Copyright
©2009 The WJG Press and Baishideng.
World J Gastroenterol. Jul 7, 2009; 15(25): 3114-3121
Published online Jul 7, 2009. doi: 10.3748/wjg.15.3114
Published online Jul 7, 2009. doi: 10.3748/wjg.15.3114
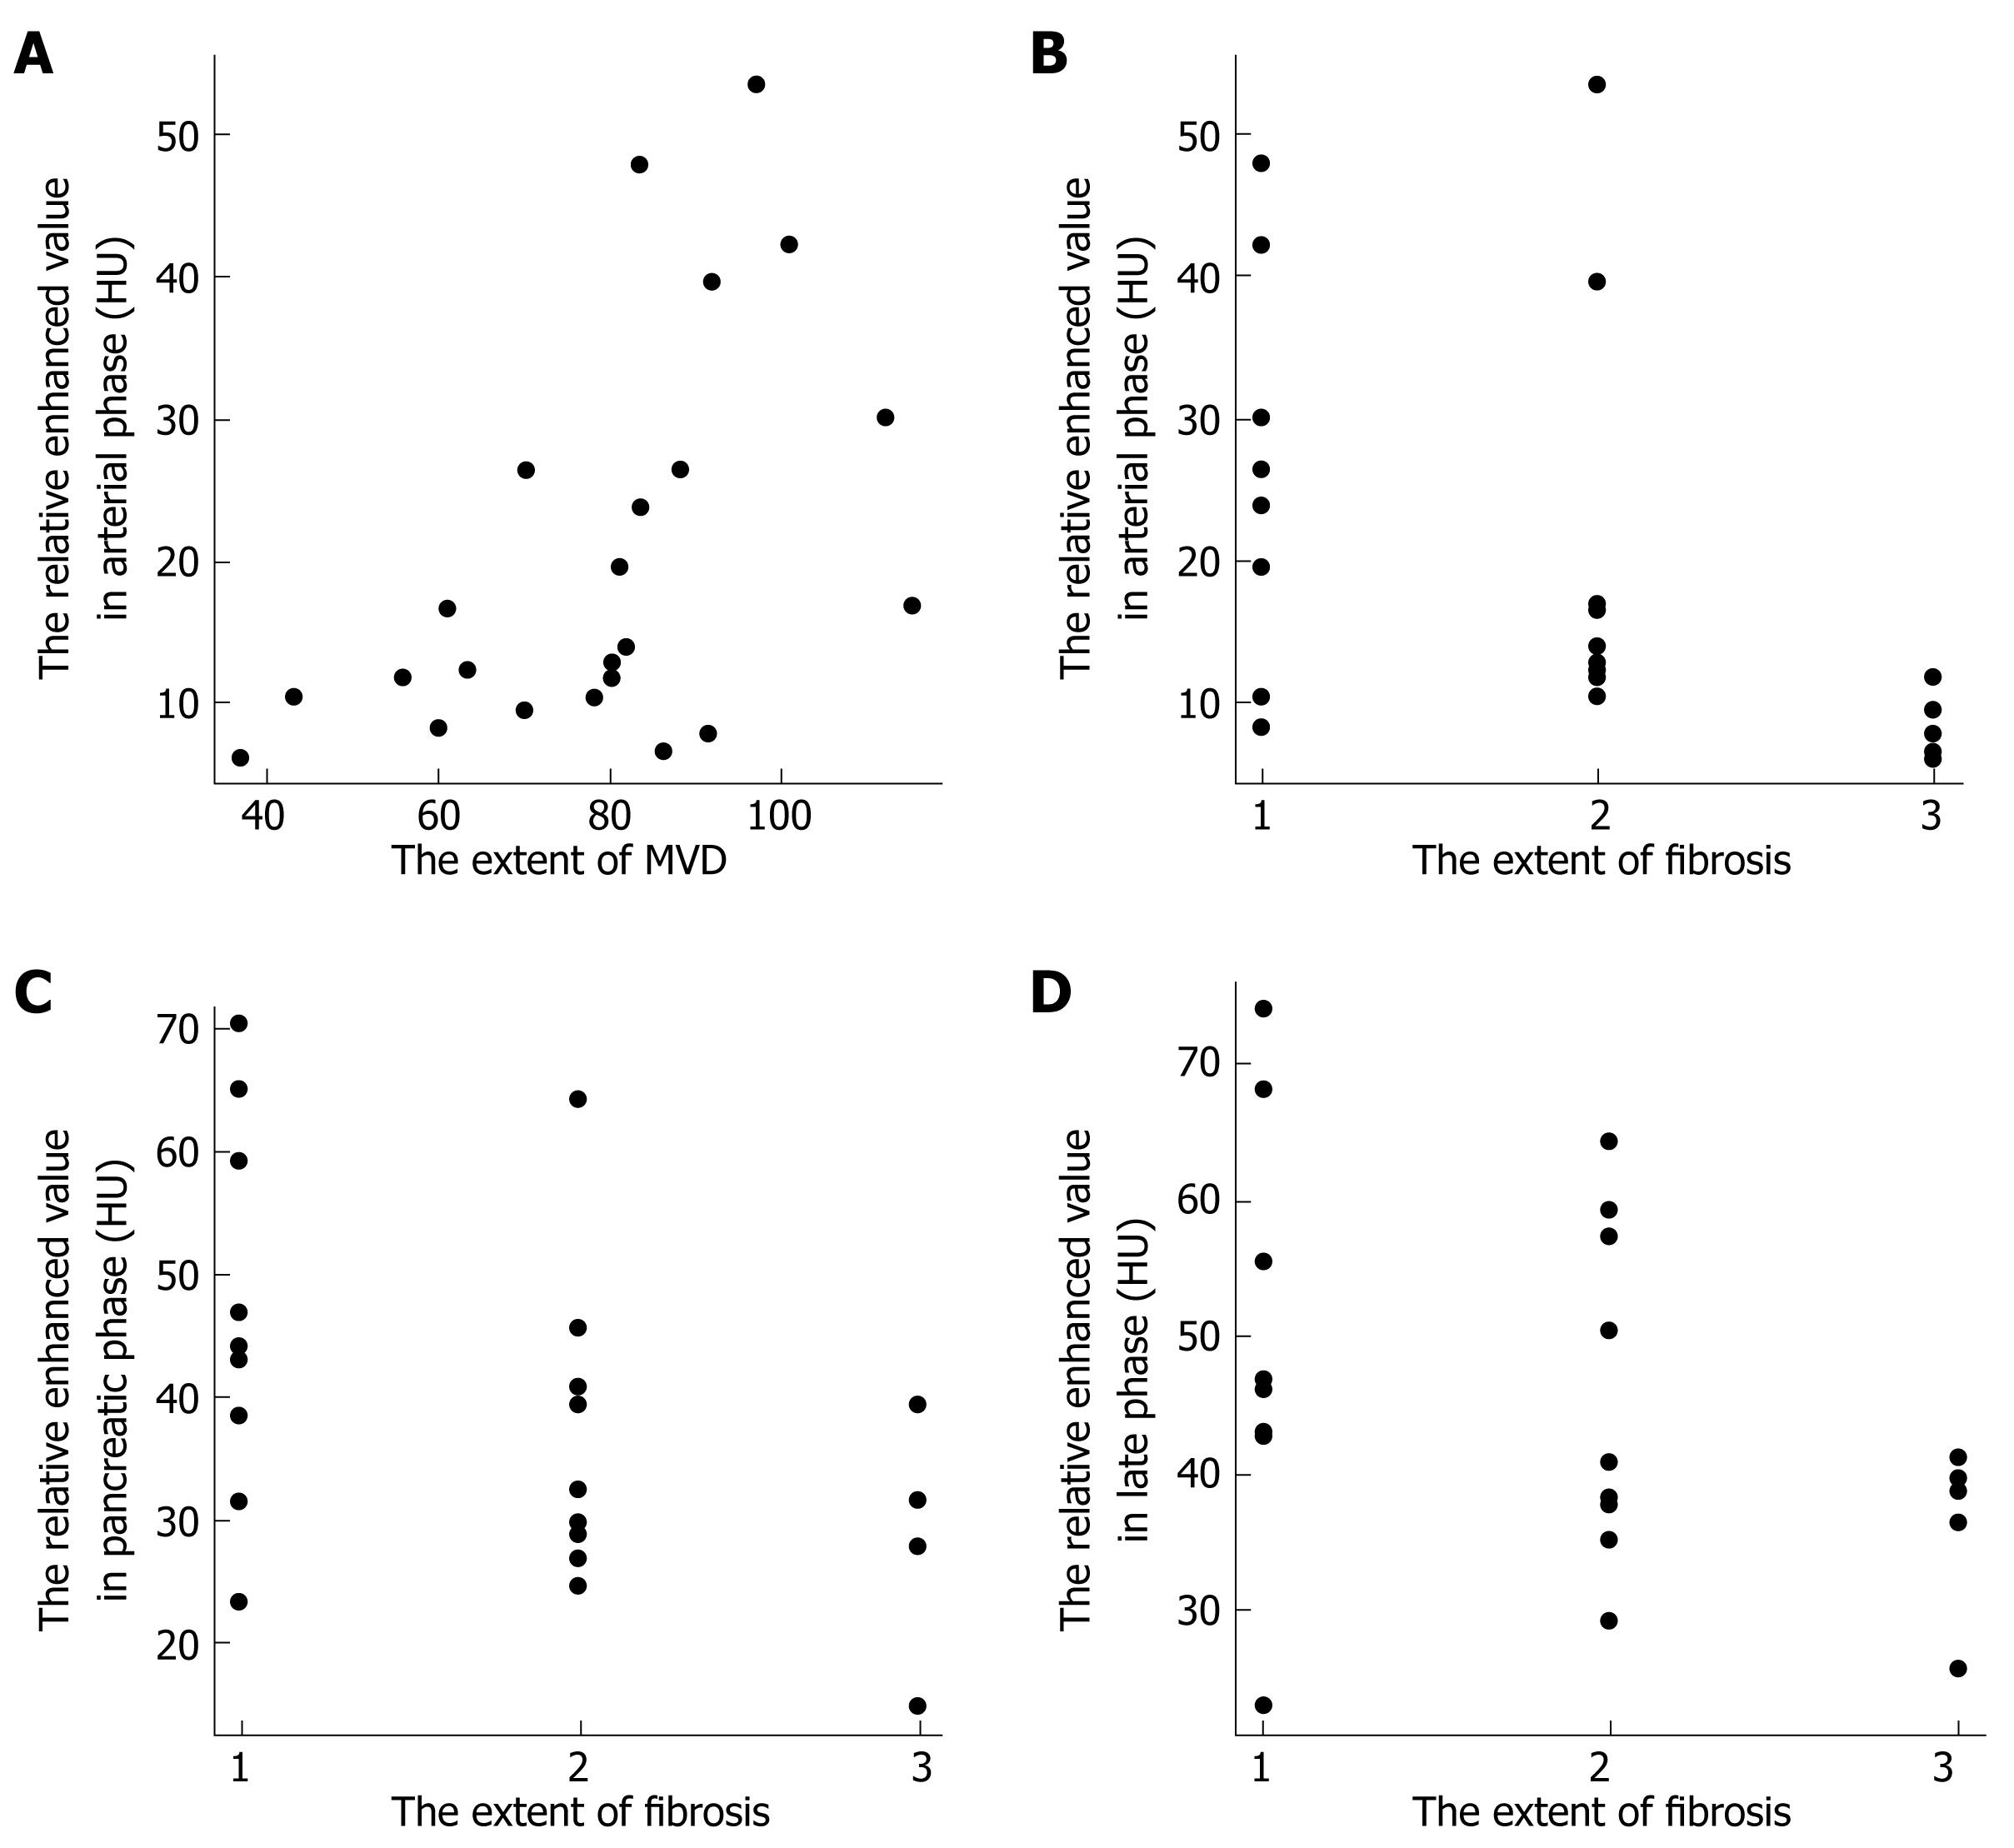
Figure 5 Scatter plots showing correlation between the relative enhanced values and histopathological findings.
A: The relatively enhanced value in the arterial phase correlated significantly with the extent of MVD (r = 0.593, P = 0.003); B: The relatively enhanced values in the arterial phase correlated significantly and negatively with the extent of fibrosis (r = -0.590, P = 0.003); C: The relatively enhanced values in the pancreatic phase correlated significantly and negatively with the extent of fibrosis (r = -0.483, P = 0.020); D: The relatively enhanced values in the late phase correlated significantly and negatively with the extent of fibrosis (r = -0.433, P = 0.039).
- Citation: Hattori Y, Gabata T, Matsui O, Mochizuki K, Kitagawa H, Kayahara M, Ohta T, Nakanuma Y. Enhancement patterns of pancreatic adenocarcinoma on conventional dynamic multi-detector row CT: Correlation with angiogenesis and fibrosis. World J Gastroenterol 2009; 15(25): 3114-3121
- URL: https://www.wjgnet.com/1007-9327/full/v15/i25/3114.htm
- DOI: https://dx.doi.org/10.3748/wjg.15.3114


