Copyright
©2009 The WJG Press and Baishideng.
World J Gastroenterol. Jul 7, 2009; 15(25): 3099-3105
Published online Jul 7, 2009. doi: 10.3748/wjg.15.3099
Published online Jul 7, 2009. doi: 10.3748/wjg.15.3099
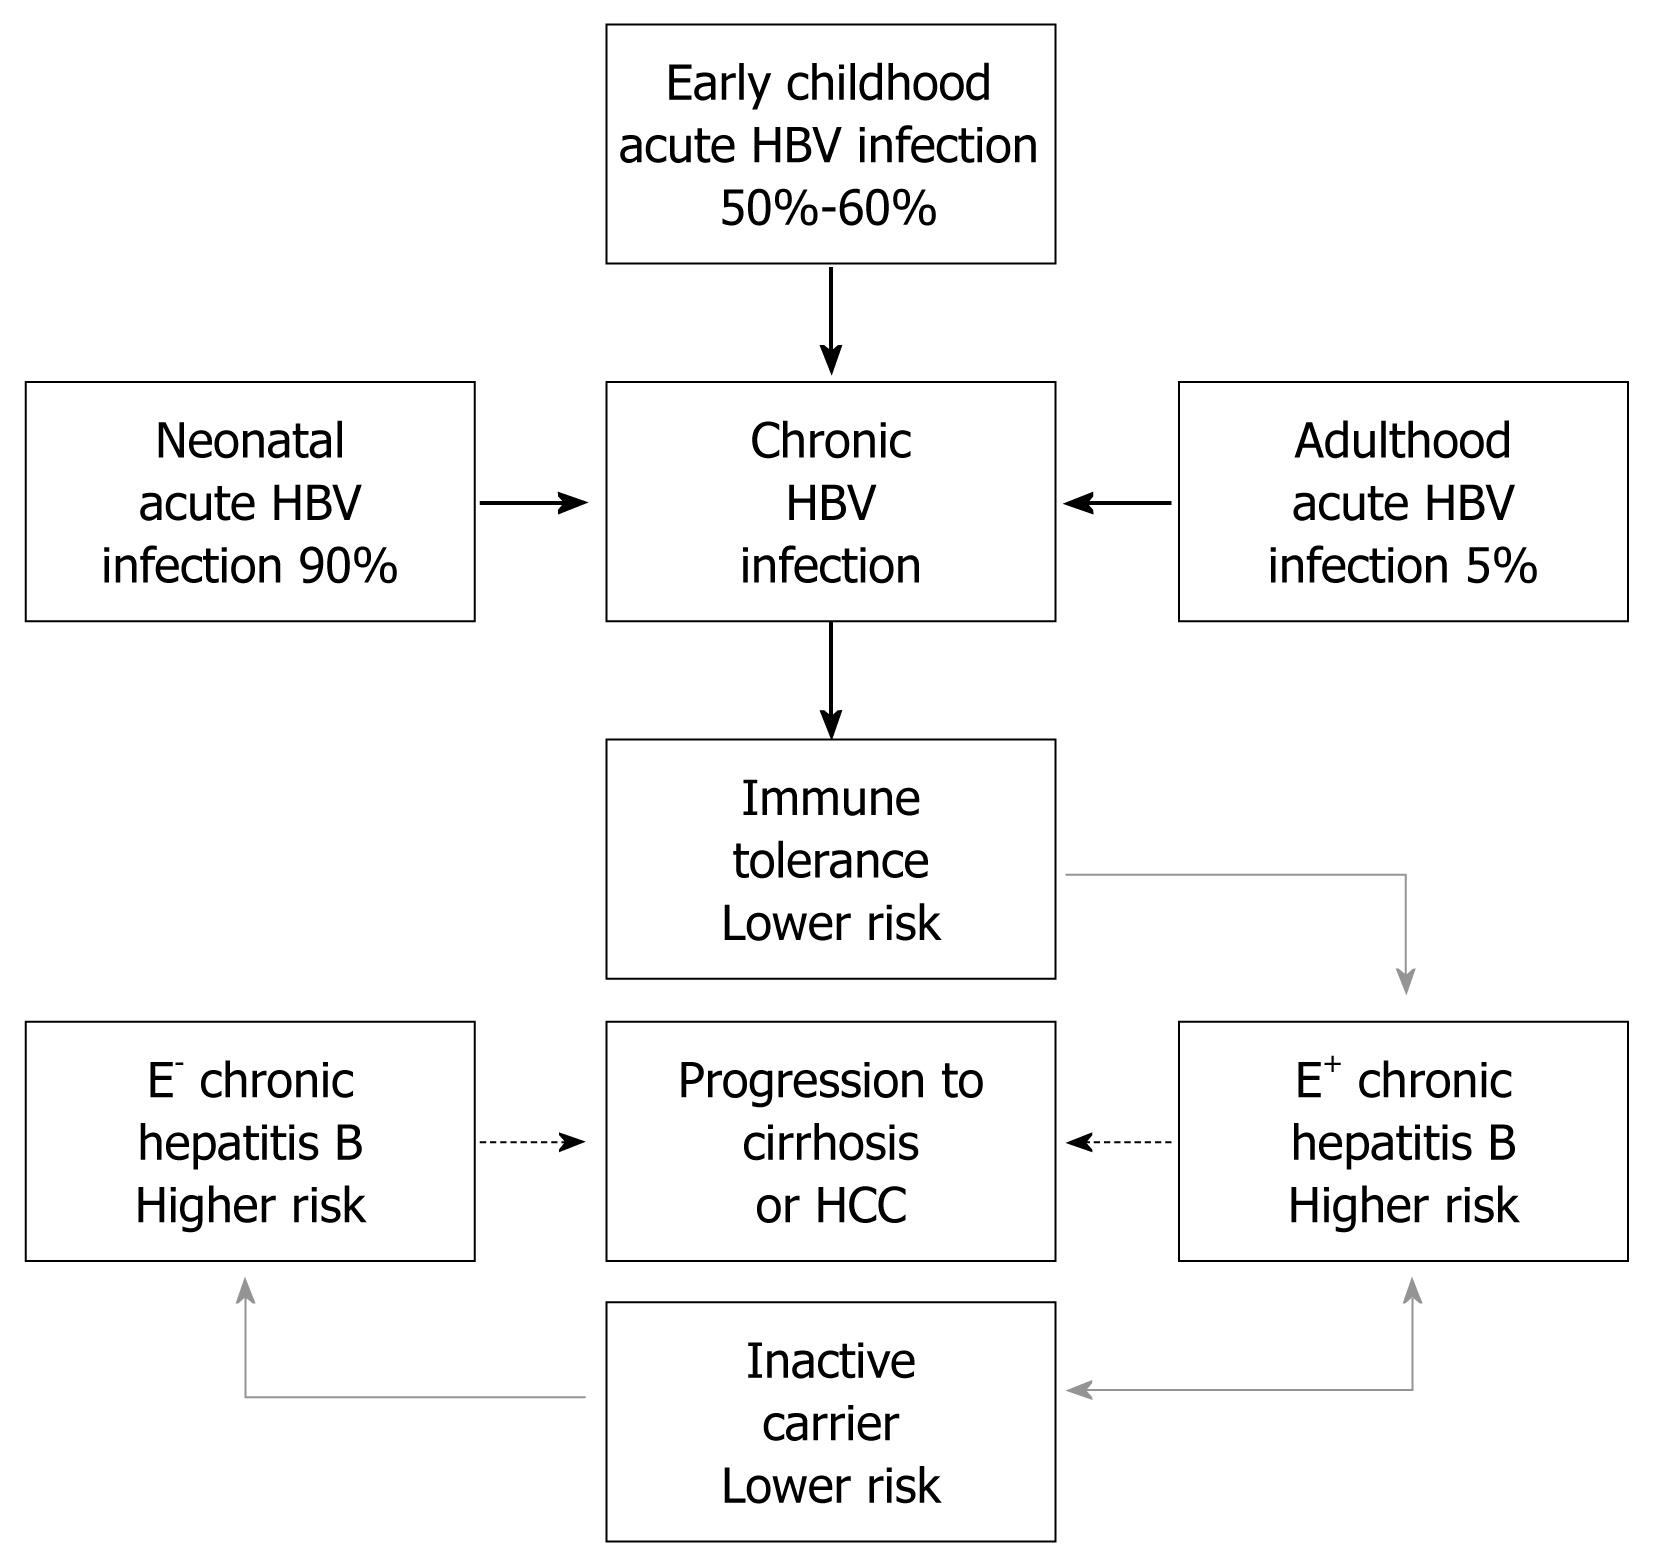
Figure 1 Phases of chronic hepatitis B virus (HBV) infection.
Thick arrows indicate HBV infection rates in different age groups, dotted arrows indicate changes in histology, grey arrows indicate changes at risk of progressing to cirrhosis or HCC (E+: HBeAg positive; E-: HBeAg negative).
- Citation: Shi YH, Shi CH. Molecular characteristics and stages of chronic hepatitis B virus infection. World J Gastroenterol 2009; 15(25): 3099-3105
- URL: https://www.wjgnet.com/1007-9327/full/v15/i25/3099.htm
- DOI: https://dx.doi.org/10.3748/wjg.15.3099


