Copyright
©2009 The WJG Press and Baishideng.
World J Gastroenterol. Jun 28, 2009; 15(24): 3046-3050
Published online Jun 28, 2009. doi: 10.3748/wjg.15.3046
Published online Jun 28, 2009. doi: 10.3748/wjg.15.3046
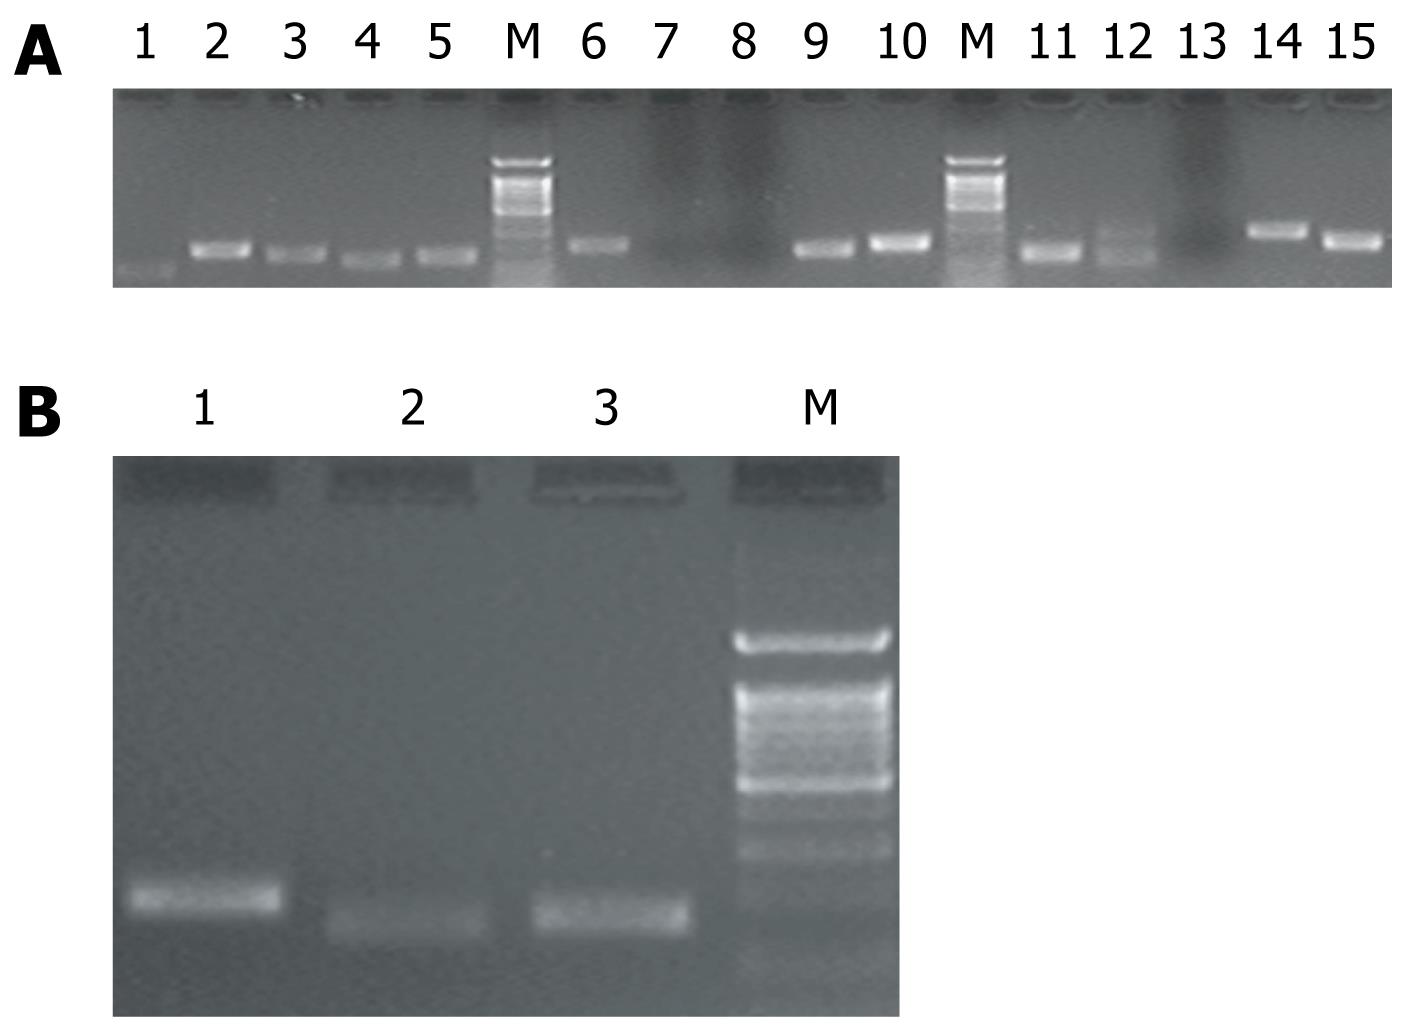
Figure 1 The Ca2+ channel subunits expression profile in INS-1 and rat β cells.
A: 12 of 15 Ca2+ channel subunits in rat pancreatic β cells. 1-5: Separately represent subunits TRPC1, TRPC4α, TRPC4β, TRPM2, and L-α1C; 6-10: Separately represent subunits L-α1D, L-α-S, L-α1F, IP3R1, and IP3R2; 11-15: IP3R3, R-α1E, Ryr1, Ryr2, and N-α1B; M: 100 bp ladder marker, (bottom band, 100 bp; the expression profile of INS-1 is the same as for rat β cells, not shown); B: L-α-S, L-α1F, and Ryr1 expressed in rat heart and skeletal muscle. 1-3: L-α-S (cDNA of skeletal muscle), L-α1F (heart), and Ryr1 (cDNA of skeletal muscle); M: 100 bp ladder marker; bottom band of M, 100 bp.
- Citation: Li F, Zhang ZM. Comparative identification of Ca2+ channel expression in INS-1 and rat pancreatic β cells. World J Gastroenterol 2009; 15(24): 3046-3050
- URL: https://www.wjgnet.com/1007-9327/full/v15/i24/3046.htm
- DOI: https://dx.doi.org/10.3748/wjg.15.3046


