Copyright
©2009 The WJG Press and Baishideng.
World J Gastroenterol. Jun 21, 2009; 15(23): 2870-2877
Published online Jun 21, 2009. doi: 10.3748/wjg.15.2870
Published online Jun 21, 2009. doi: 10.3748/wjg.15.2870
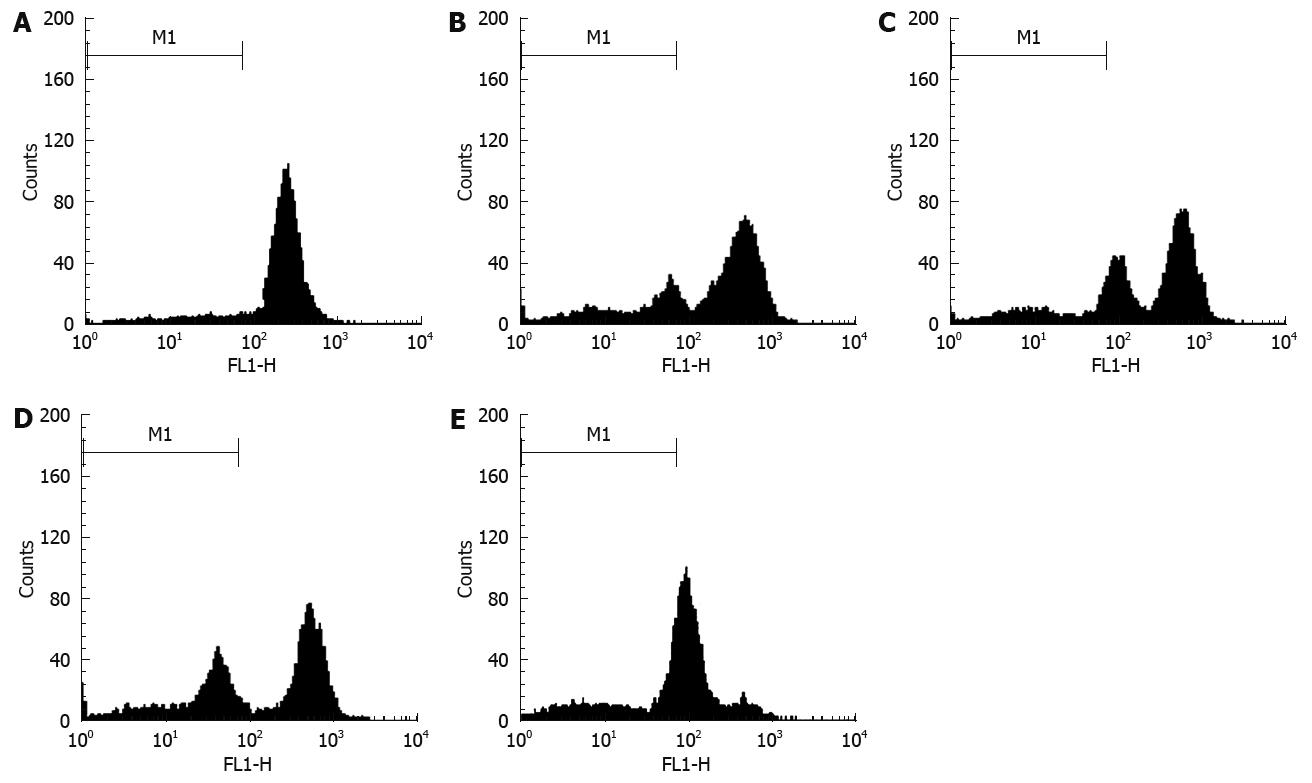
Figure 5 FCM analysis of mitochondrial membrane potential in human SGC7901 cells with 30 &mgr;mol/L alisol B acetate for various time periods.
The zero concentration was defined as control. The percentage of cells stained with Rh-123 was determined by FCM as described in the Materials and Methods. A: Control; B-E: 12, 24, 48 and 72 h.
-
Citation: Xu YH, Zhao LJ, Li Y. Alisol B acetate induces apoptosis of SGC7901 cells
via mitochondrial and phosphatidylinositol 3-kinases/Akt signaling pathways. World J Gastroenterol 2009; 15(23): 2870-2877 - URL: https://www.wjgnet.com/1007-9327/full/v15/i23/2870.htm
- DOI: https://dx.doi.org/10.3748/wjg.15.2870


