Copyright
©2009 The WJG Press and Baishideng.
World J Gastroenterol. Jun 21, 2009; 15(23): 2862-2869
Published online Jun 21, 2009. doi: 10.3748/wjg.15.2862
Published online Jun 21, 2009. doi: 10.3748/wjg.15.2862
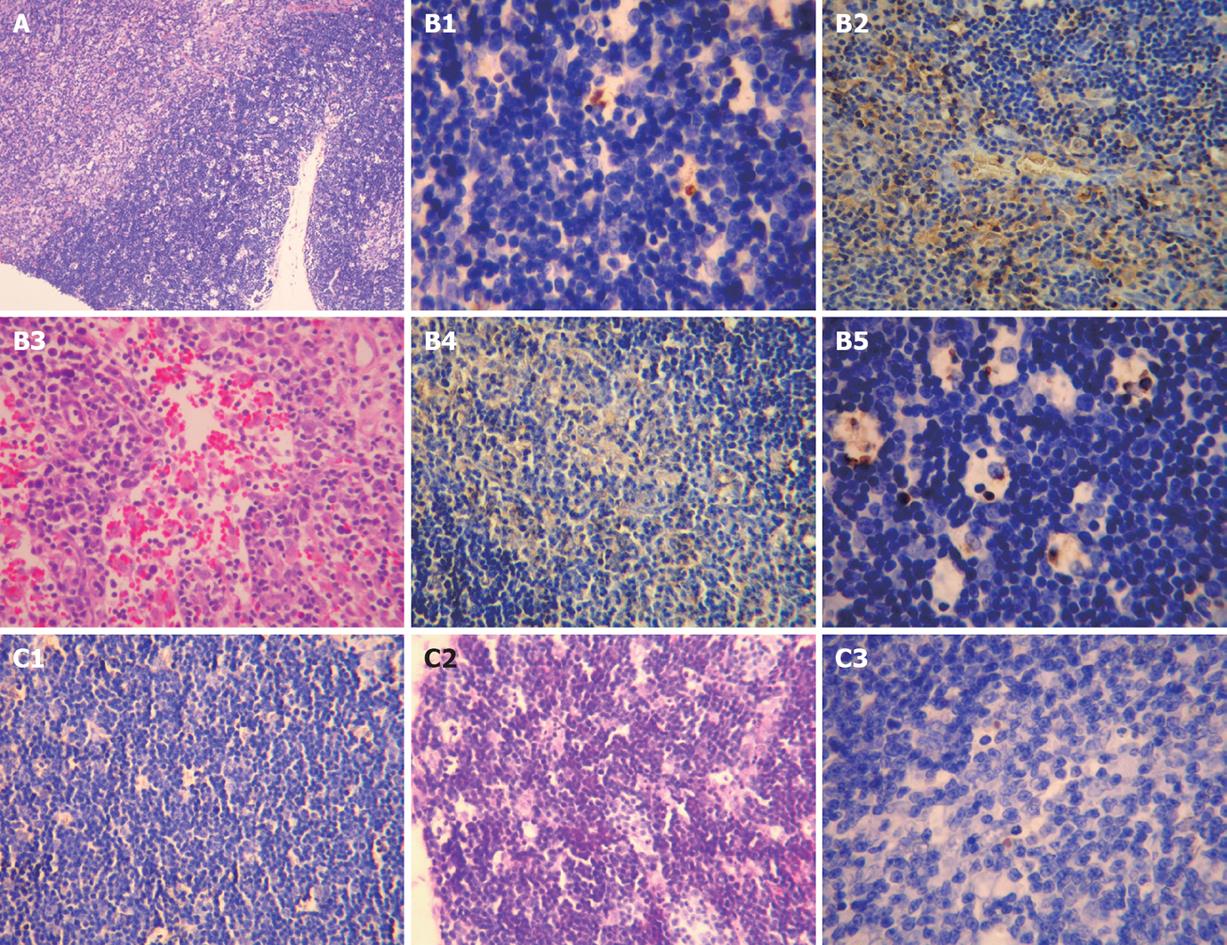
Figure 3 Pathological changes in thymus of sham-operated group (A), model control group (B), and treatment group (C).
A1: 28 d. Clear structure of thymus lobules and a clear boundary between thymus cortex and medulla (HE, × 100); B1: 7 d. Sporadic apoptotic cells in thymus (TUNEL, × 400); B2: 21 d. Thymus (++) (NF-κB p65, × 200); B3: 28 d. An obscure boundary between the thymus cortex and medulla with hemorrhage in the medulla (HE, × 200); B4: 28 d. Thymus (++) (Bax, × 200); B5: 28 d. Sporadic apoptotic cells in thymus (TUNEL, × 400); C1: 21 d. Thymus (not shown) (NF-κB p65, × 200); C2: 28 d. Normal thymus (HE, × 200); C3: 28 d. Sporadic apoptotic cells in thymus (TUNEL, × 400).
-
Citation: Zhang RP, Zhang XP, Ruan YF, Ye SY, Zhao HC, Cheng QH, Wu DJ. Protective effect of
Radix Astragali injection on immune organs of rats with obstructive jaundice and its mechanism. World J Gastroenterol 2009; 15(23): 2862-2869 - URL: https://www.wjgnet.com/1007-9327/full/v15/i23/2862.htm
- DOI: https://dx.doi.org/10.3748/wjg.15.2862


