Copyright
©2009 The WJG Press and Baishideng.
World J Gastroenterol. Jun 14, 2009; 15(22): 2763-2767
Published online Jun 14, 2009. doi: 10.3748/wjg.15.2763
Published online Jun 14, 2009. doi: 10.3748/wjg.15.2763
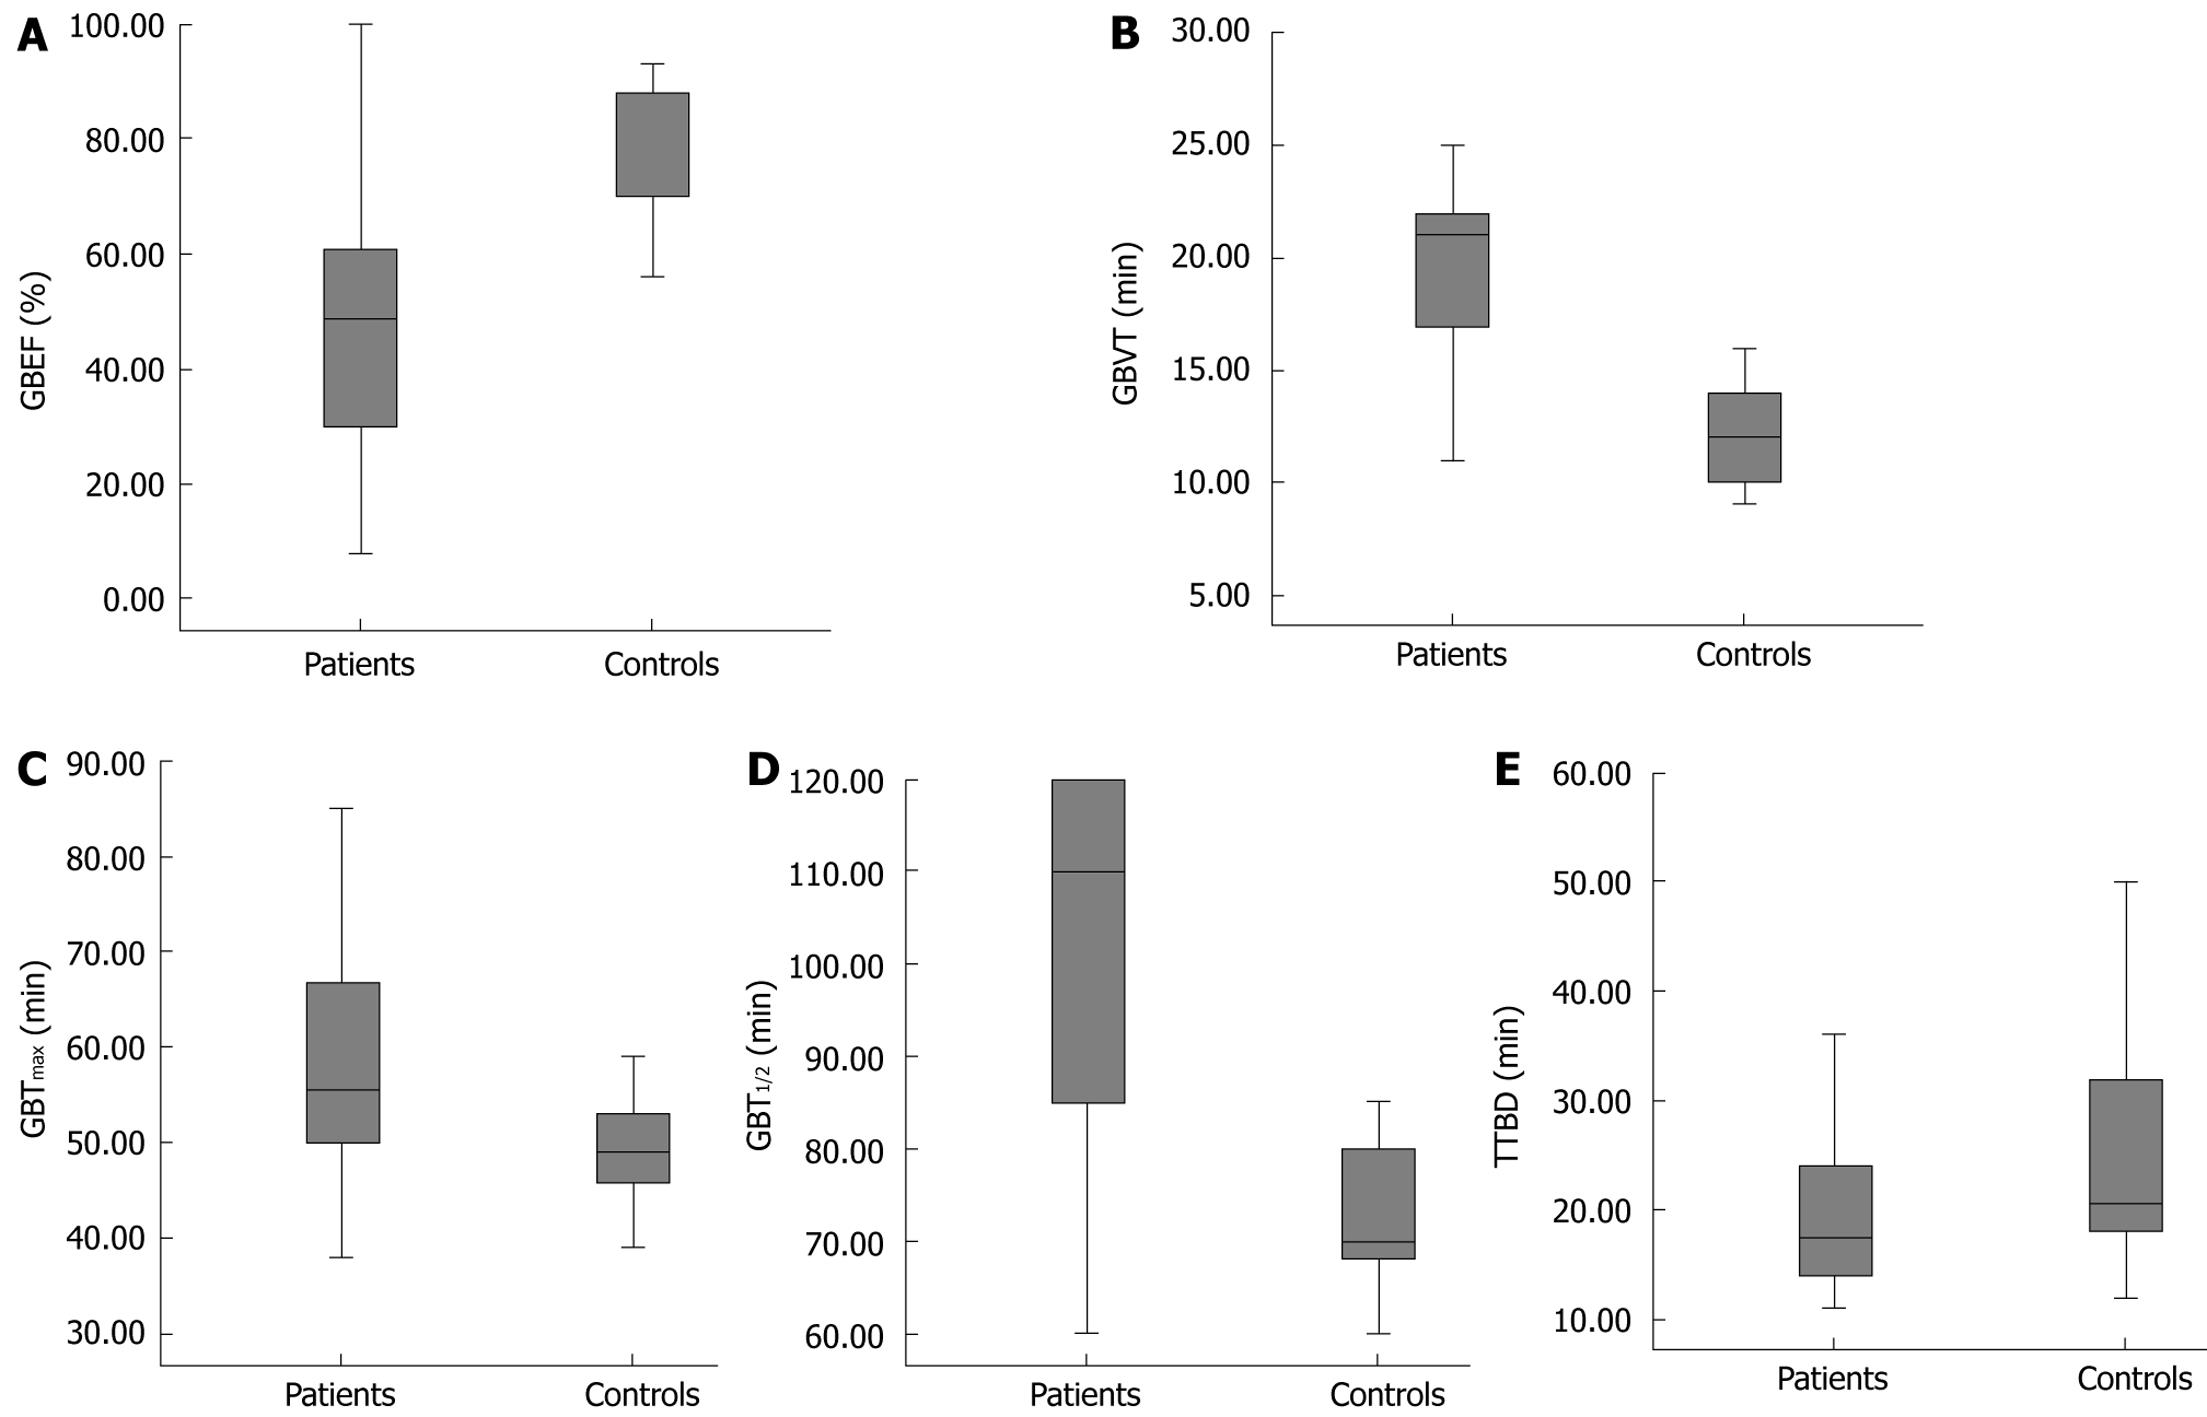
Figure 2 Parameters of gallbladder function.
A: Mean GBEF of the patient group was significantly decreased when compared with the control group (P = 0.000); B: Mean GBVT was significantly longer in asymptomatic gallbladder patients than in the control group (P = 0.000); C: GBTmax was significantly longer in the patient group (P = 0.015); D: GBT1/2 was significantly prolonged in the patient group (P = 0.001); E: There was no significant difference between TTBD in the two groups.
- Citation: Çerçi SS, Özbek FM, Çerçi C, Baykal B, Eroğlu HE, Baykal Z, Yıldız M, Sağlam S, Yeşildağ A. Gallbladder function and dynamics of bile flow in asymptomatic gallstone disease. World J Gastroenterol 2009; 15(22): 2763-2767
- URL: https://www.wjgnet.com/1007-9327/full/v15/i22/2763.htm
- DOI: https://dx.doi.org/10.3748/wjg.15.2763


