Copyright
©2009 The WJG Press and Baishideng.
World J Gastroenterol. Jun 7, 2009; 15(21): 2602-2608
Published online Jun 7, 2009. doi: 10.3748/wjg.15.2602
Published online Jun 7, 2009. doi: 10.3748/wjg.15.2602
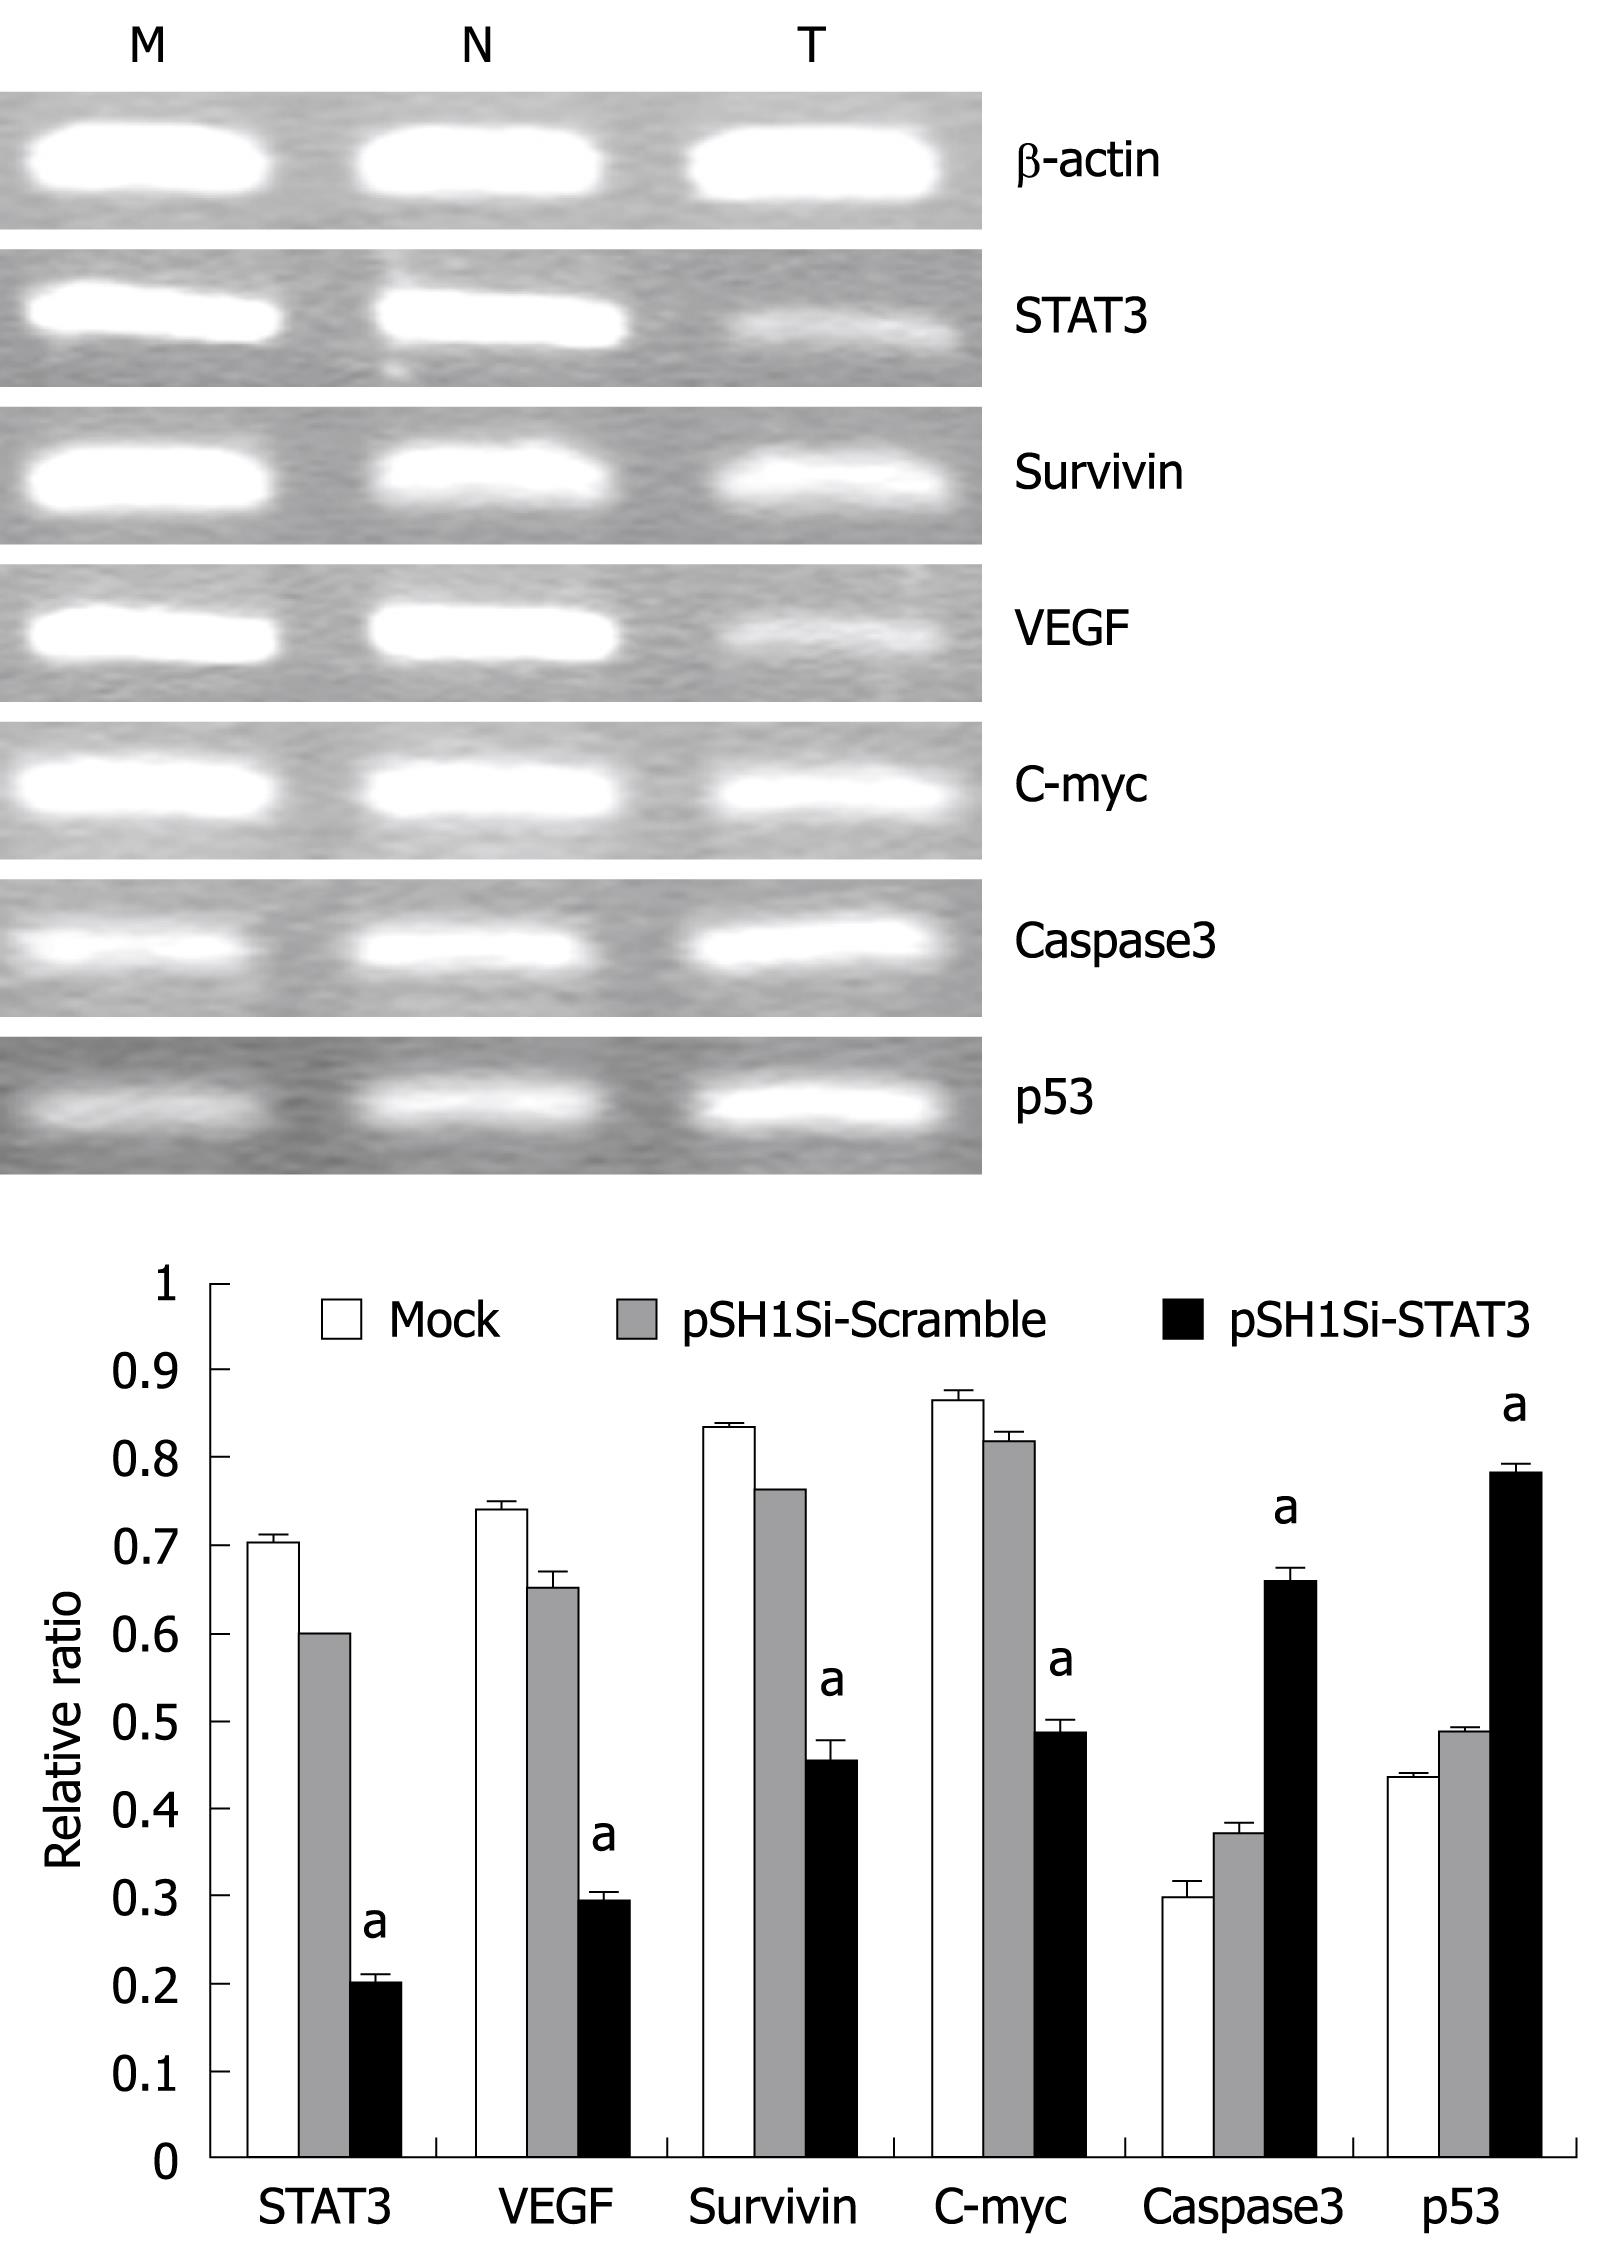
Figure 4 RT-PCR analysis of mRNA for STAT3 and related genes in tumor tissues of different treated groups.
M: Mock-treated group; N: pSH1Si-Scramble group; T: pSH1Si-STAT3 group. aP < 0.01 vs pSH1Si-Scramble group.
- Citation: Li J, Piao YF, Jiang Z, Chen L, Sun HB. Silencing of signal transducer and activator of transcription 3 expression by RNA interference suppresses growth of human hepatocellular carcinoma in tumor-bearing nude mice. World J Gastroenterol 2009; 15(21): 2602-2608
- URL: https://www.wjgnet.com/1007-9327/full/v15/i21/2602.htm
- DOI: https://dx.doi.org/10.3748/wjg.15.2602


