Copyright
©2009 The WJG Press and Baishideng.
World J Gastroenterol. Jan 14, 2009; 15(2): 219-225
Published online Jan 14, 2009. doi: 10.3748/wjg.15.219
Published online Jan 14, 2009. doi: 10.3748/wjg.15.219
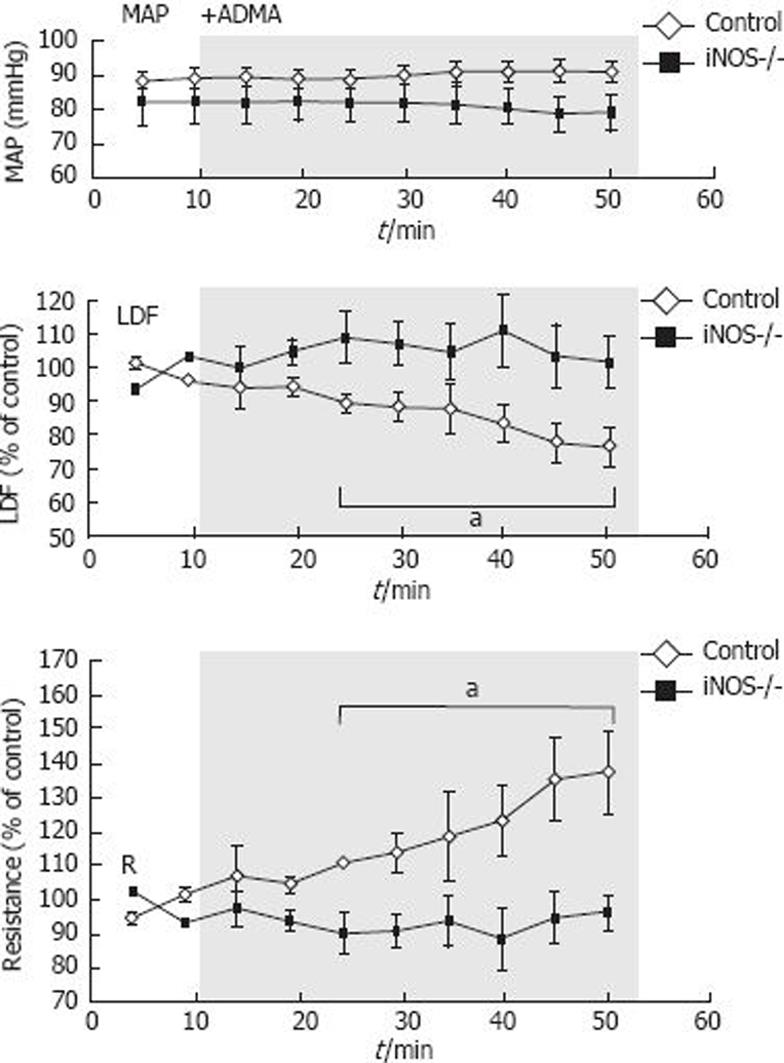
Figure 4 Blood flow measurements in the ADMA control group (n = 5-6), and iNOS-/- mice treated with ADMA (n = 5).
Mean arterial blood pressure (MAP) is expressed in mm Hg, and blood flow (LDF) and vascular resistance (R) in percent of the control period at time-points 5-10 min. The mucosa was exposed to 500 &mgr;mol/L ADMA for 40 min. Values are mean ± SE. aP < 0.05 compared with the control period.
-
Citation: Henriksnäs J, Atuma C, Phillipson M, Sandler S, Engstrand L, Holm L. Acute effects of
Helicobacter pylori extracts on gastric mucosal blood flow in the mouse. World J Gastroenterol 2009; 15(2): 219-225 - URL: https://www.wjgnet.com/1007-9327/full/v15/i2/219.htm
- DOI: https://dx.doi.org/10.3748/wjg.15.219


