Copyright
©2009 The WJG Press and Baishideng.
World J Gastroenterol. Jan 14, 2009; 15(2): 182-191
Published online Jan 14, 2009. doi: 10.3748/wjg.15.182
Published online Jan 14, 2009. doi: 10.3748/wjg.15.182
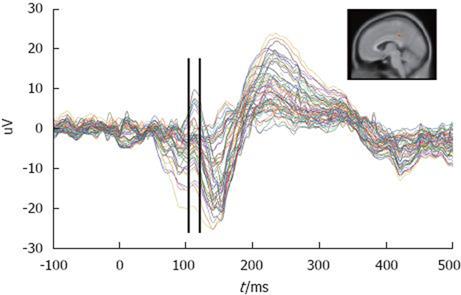
Figure 5 This is a butterfly plot of 62 channels (data of all 62 channels superimposed on each other).
The vertical lines mark the time course of the peak that was used for analysis. The red dot on the MRI image on the top right corner represents where the activity was calculated to be by MUSIC.
- Citation: Sharma A, Lelic D, Brock C, Paine P, Aziz Q. New technologies to investigate the brain-gut axis. World J Gastroenterol 2009; 15(2): 182-191
- URL: https://www.wjgnet.com/1007-9327/full/v15/i2/182.htm
- DOI: https://dx.doi.org/10.3748/wjg.15.182


