Copyright
©2009 The WJG Press and Baishideng.
World J Gastroenterol. Jan 14, 2009; 15(2): 182-191
Published online Jan 14, 2009. doi: 10.3748/wjg.15.182
Published online Jan 14, 2009. doi: 10.3748/wjg.15.182
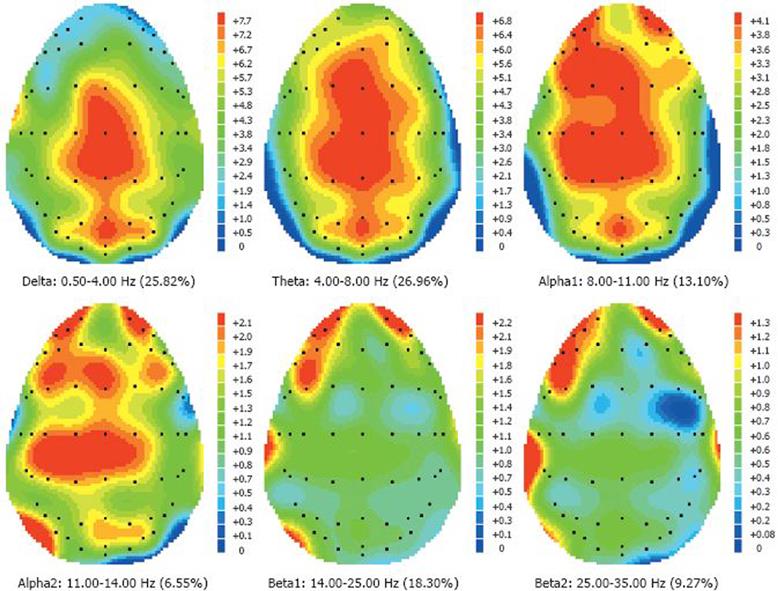
Figure 3 Example from painful CEP from the gut performed in a healthy volunteer.
The figure shows the topographies at different frequency bands from one subject, and the percentage of the presence of each frequency band in the overall signal. The black dots represent electrodes. The colours represent how much power a particular frequency band holds at each electrode. The scales describing the colours are to the right of the topographies.
- Citation: Sharma A, Lelic D, Brock C, Paine P, Aziz Q. New technologies to investigate the brain-gut axis. World J Gastroenterol 2009; 15(2): 182-191
- URL: https://www.wjgnet.com/1007-9327/full/v15/i2/182.htm
- DOI: https://dx.doi.org/10.3748/wjg.15.182


