Copyright
©2009 The WJG Press and Baishideng.
World J Gastroenterol. Jan 14, 2009; 15(2): 151-159
Published online Jan 14, 2009. doi: 10.3748/wjg.15.151
Published online Jan 14, 2009. doi: 10.3748/wjg.15.151
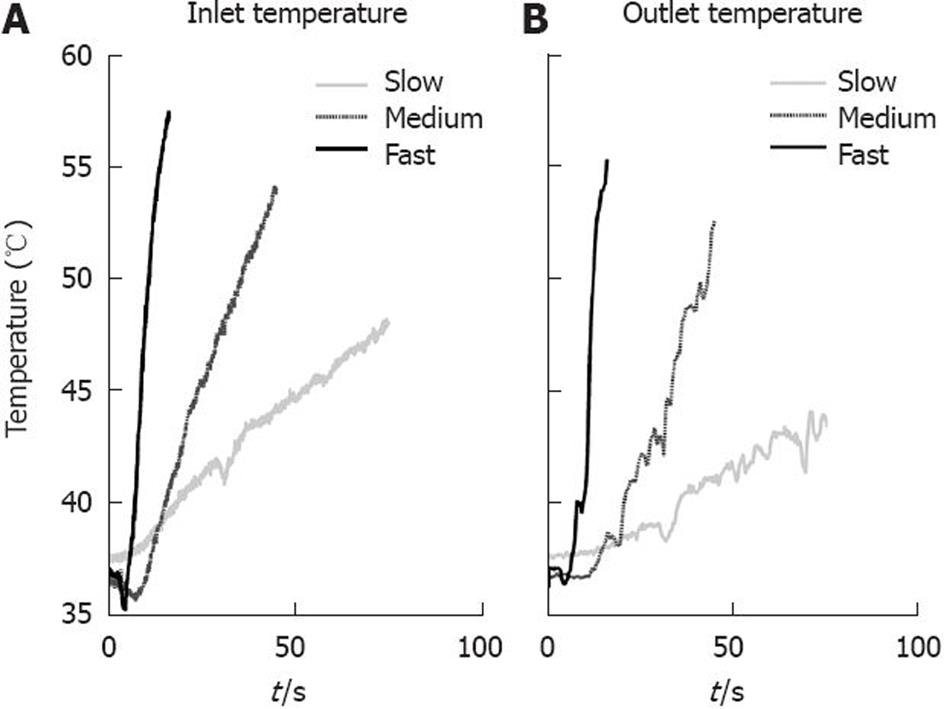
Figure 5 Temperature stimuli with three different incline rates.
A: Left graph shows the temperature measured at the inlet of the bag; B: Right graph shows the temperature measured at the outlet of the bag.
- Citation: Brock C, Arendt-Nielsen L, Wilder-Smith O, Drewes AM. Sensory testing of the human gastrointestinal tract. World J Gastroenterol 2009; 15(2): 151-159
- URL: https://www.wjgnet.com/1007-9327/full/v15/i2/151.htm
- DOI: https://dx.doi.org/10.3748/wjg.15.151


