Copyright
©2009 The WJG Press and Baishideng.
World J Gastroenterol. Jan 14, 2009; 15(2): 144-150
Published online Jan 14, 2009. doi: 10.3748/wjg.15.144
Published online Jan 14, 2009. doi: 10.3748/wjg.15.144
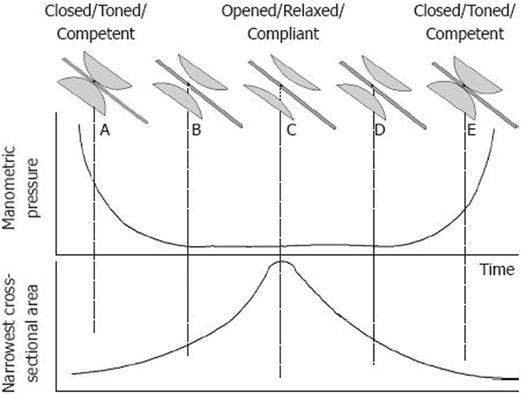
Figure 5 Diagram showing the difference between manometry and cross-sectional area (CSA) for measuring luminal changes in the oesophago-gastric junction during opening and closing.
At point A where the junction is closed, there is a high pressure and a low CSA representing the toned sphincteric region. As the sphincter relaxes, very quickly the manometry catheter is no longer squeezed, and at point B the pressure is zero or very low. However, this opening is detected by an increase in CSA at B. At C the sphincter is fully relaxed; but, there is still no useful information from manometry despite the CSA increasing even further. The pressure does not start to rise again until the sphincter is fully closed and toned at E.
- Citation: McMahon BP, Jobe BA, Pandolfino JE, Gregersen H. Do we really understand the role of the oesophagogastric junction in disease? World J Gastroenterol 2009; 15(2): 144-150
- URL: https://www.wjgnet.com/1007-9327/full/v15/i2/144.htm
- DOI: https://dx.doi.org/10.3748/wjg.15.144


