Copyright
©2009 The WJG Press and Baishideng.
World J Gastroenterol. Jan 14, 2009; 15(2): 139-143
Published online Jan 14, 2009. doi: 10.3748/wjg.15.139
Published online Jan 14, 2009. doi: 10.3748/wjg.15.139
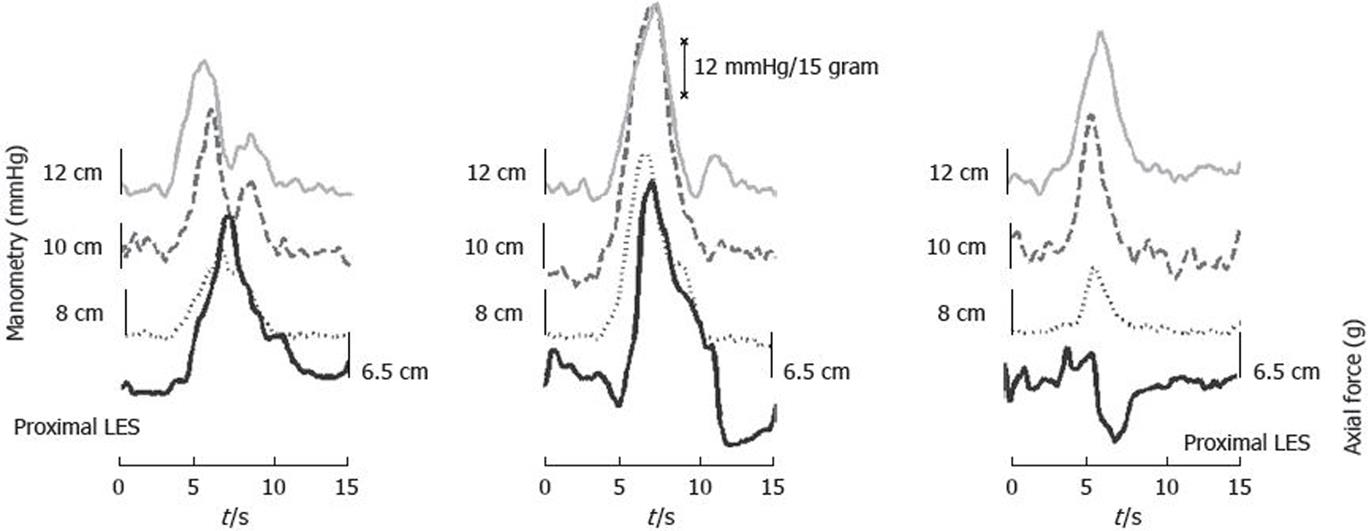
Figure 2 A voluntary dry swallow (time = 0) from three subjects with a bag volume of 2 mL.
The solid black tracings are the axial force recorded 6.5 cm proximal to the lower esophageal sphincter, and the three other tracings are the pressure recorded 12 cm, 10 cm and 8 cm proximal to the lower esophageal sphincter. Using the manometric tracings, the first swallow (left) showed a normal propagating peristaltic wave and the resulting axial force response was as expected. The swallow of the second subject (middle tracings) shows a rather powerful pressure amplitude; but, it is not propagating (peak amplitudes are similar in time). In contrast, the axial force response is comparable in amplitude to that in the first subject (left tracings) although it is followed by axial force in the oral direction (negative value). In this case, the interpretation of the manometric recording would be flawed if the axial force had not been recorded simultaneously. The third person (right tracings) had lower manometric amplitudes during swallowing, without any propagation. The axial force response is different from the swallowing in the second person (middle tracings), as there is a weak reflux (oral axial force). The data shown is taken from a study in our group where the data is still being analyzed.
- Citation: Gravesen FH, Funch-Jensen P, Gregersen H, Drewes AM. Axial force measurement for esophageal function testing. World J Gastroenterol 2009; 15(2): 139-143
- URL: https://www.wjgnet.com/1007-9327/full/v15/i2/139.htm
- DOI: https://dx.doi.org/10.3748/wjg.15.139


