Copyright
©2009 The WJG Press and Baishideng.
World J Gastroenterol. May 21, 2009; 15(19): 2329-2335
Published online May 21, 2009. doi: 10.3748/wjg.15.2329
Published online May 21, 2009. doi: 10.3748/wjg.15.2329
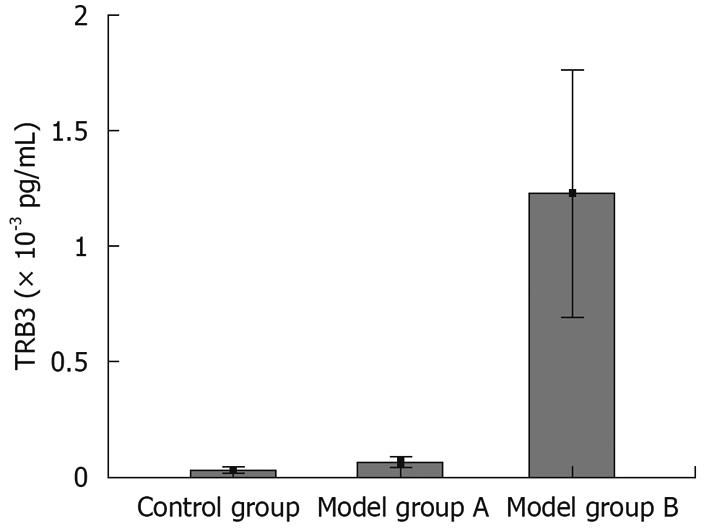
Figure 3 Comparison of TRB3 expression levels among the three groups.
The TRB3 mRNA expression level in group B was significantly (P < 0.01) higher than in the control group and group A. There was no significant difference (P > 0.05) between group A and the control group.
- Citation: Wang YG, Shi M, Wang T, Shi T, Wei J, Wang N, Chen XM. Signal transduction mechanism of TRB3 in rats with non-alcoholic fatty liver disease. World J Gastroenterol 2009; 15(19): 2329-2335
- URL: https://www.wjgnet.com/1007-9327/full/v15/i19/2329.htm
- DOI: https://dx.doi.org/10.3748/wjg.15.2329


