Copyright
©2009 The WJG Press and Baishideng.
World J Gastroenterol. May 21, 2009; 15(19): 2329-2335
Published online May 21, 2009. doi: 10.3748/wjg.15.2329
Published online May 21, 2009. doi: 10.3748/wjg.15.2329
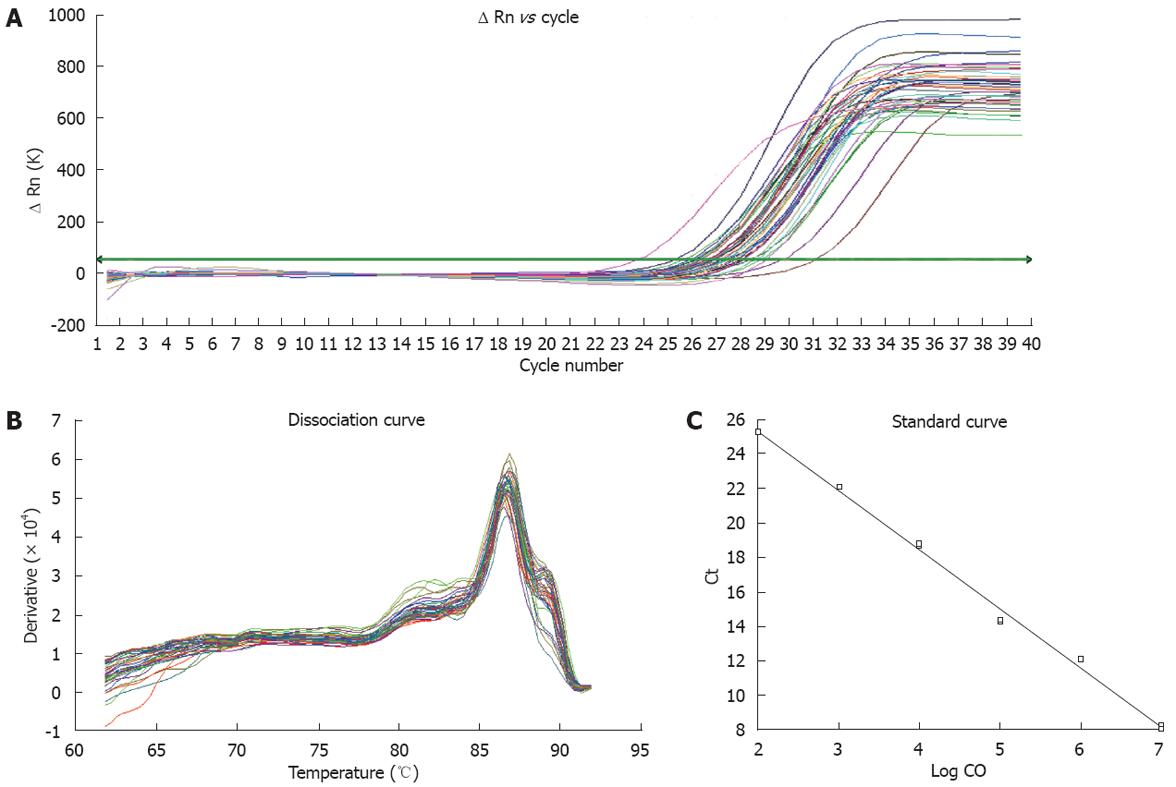
Figure 2 Fluorescent quantitative PCR for measurement of TRB3 mRNA expression levels.
Real-time PCR was used for absolute quantification analysis. A: Amplification curve with the threshold value set in the exponential growth phase; B: Melting curve showing no primer dimer in PCR reaction; C: Standard curve for the relation (r = 0.99) between amplified results of PCR and Ct value of standard samples was in accordance with the requirements of real-time PCR. The intensities of fluorescent signals indicated the variation of product concentrations.
- Citation: Wang YG, Shi M, Wang T, Shi T, Wei J, Wang N, Chen XM. Signal transduction mechanism of TRB3 in rats with non-alcoholic fatty liver disease. World J Gastroenterol 2009; 15(19): 2329-2335
- URL: https://www.wjgnet.com/1007-9327/full/v15/i19/2329.htm
- DOI: https://dx.doi.org/10.3748/wjg.15.2329


