Copyright
©2009 The WJG Press and Baishideng.
World J Gastroenterol. May 21, 2009; 15(19): 2329-2335
Published online May 21, 2009. doi: 10.3748/wjg.15.2329
Published online May 21, 2009. doi: 10.3748/wjg.15.2329
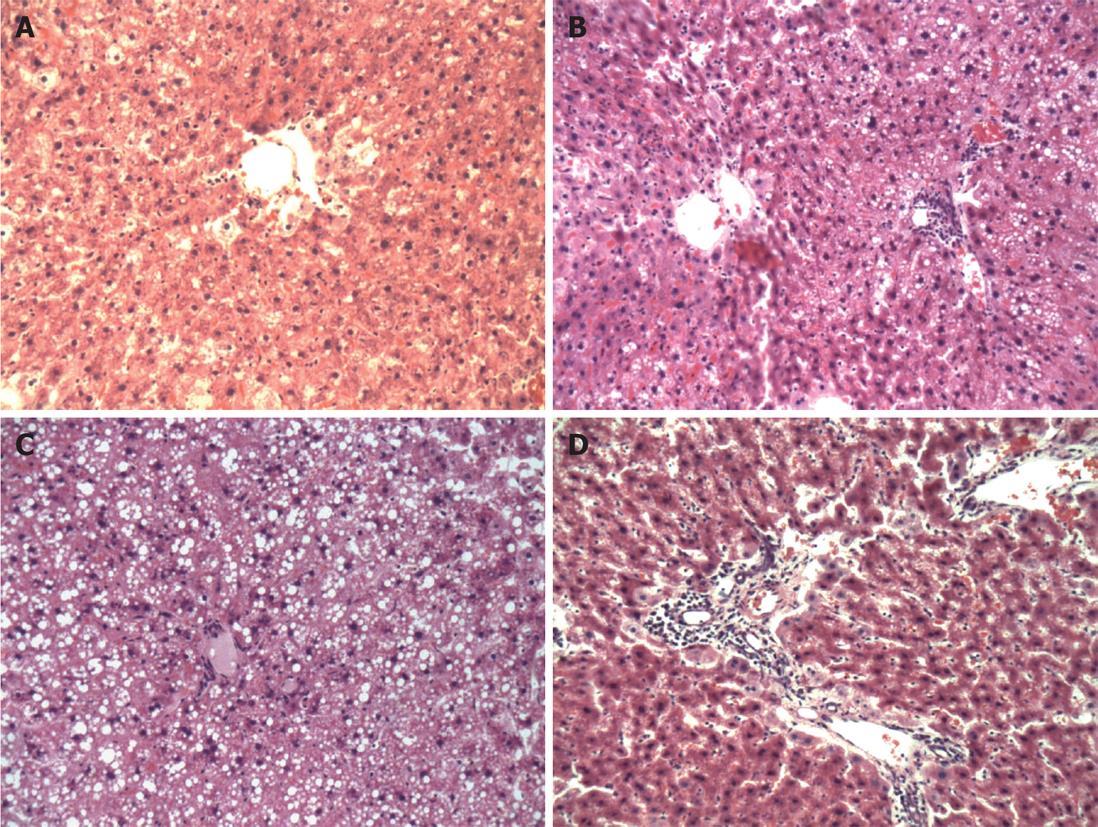
Figure 1 The degree of hepatic steatosis in each group.
A: In group A, mild hepatic steatosis was observed on histological examination (HE, × 200); B: In group A, moderate hepatic steatosis was observed (HE, × 200); C: In group B, hepatocytes showed severe hepatic steatosis. Liver cells with hepatic steatosis accounted for over 75% of the total liver cells (HE, × 200); D: In group B, hepatocytes showed severe steatosis along with portal inflammation (HE, × 200).
- Citation: Wang YG, Shi M, Wang T, Shi T, Wei J, Wang N, Chen XM. Signal transduction mechanism of TRB3 in rats with non-alcoholic fatty liver disease. World J Gastroenterol 2009; 15(19): 2329-2335
- URL: https://www.wjgnet.com/1007-9327/full/v15/i19/2329.htm
- DOI: https://dx.doi.org/10.3748/wjg.15.2329


