Copyright
©2009 The WJG Press and Baishideng.
World J Gastroenterol. Apr 28, 2009; 15(16): 1966-1972
Published online Apr 28, 2009. doi: 10.3748/wjg.15.1966
Published online Apr 28, 2009. doi: 10.3748/wjg.15.1966
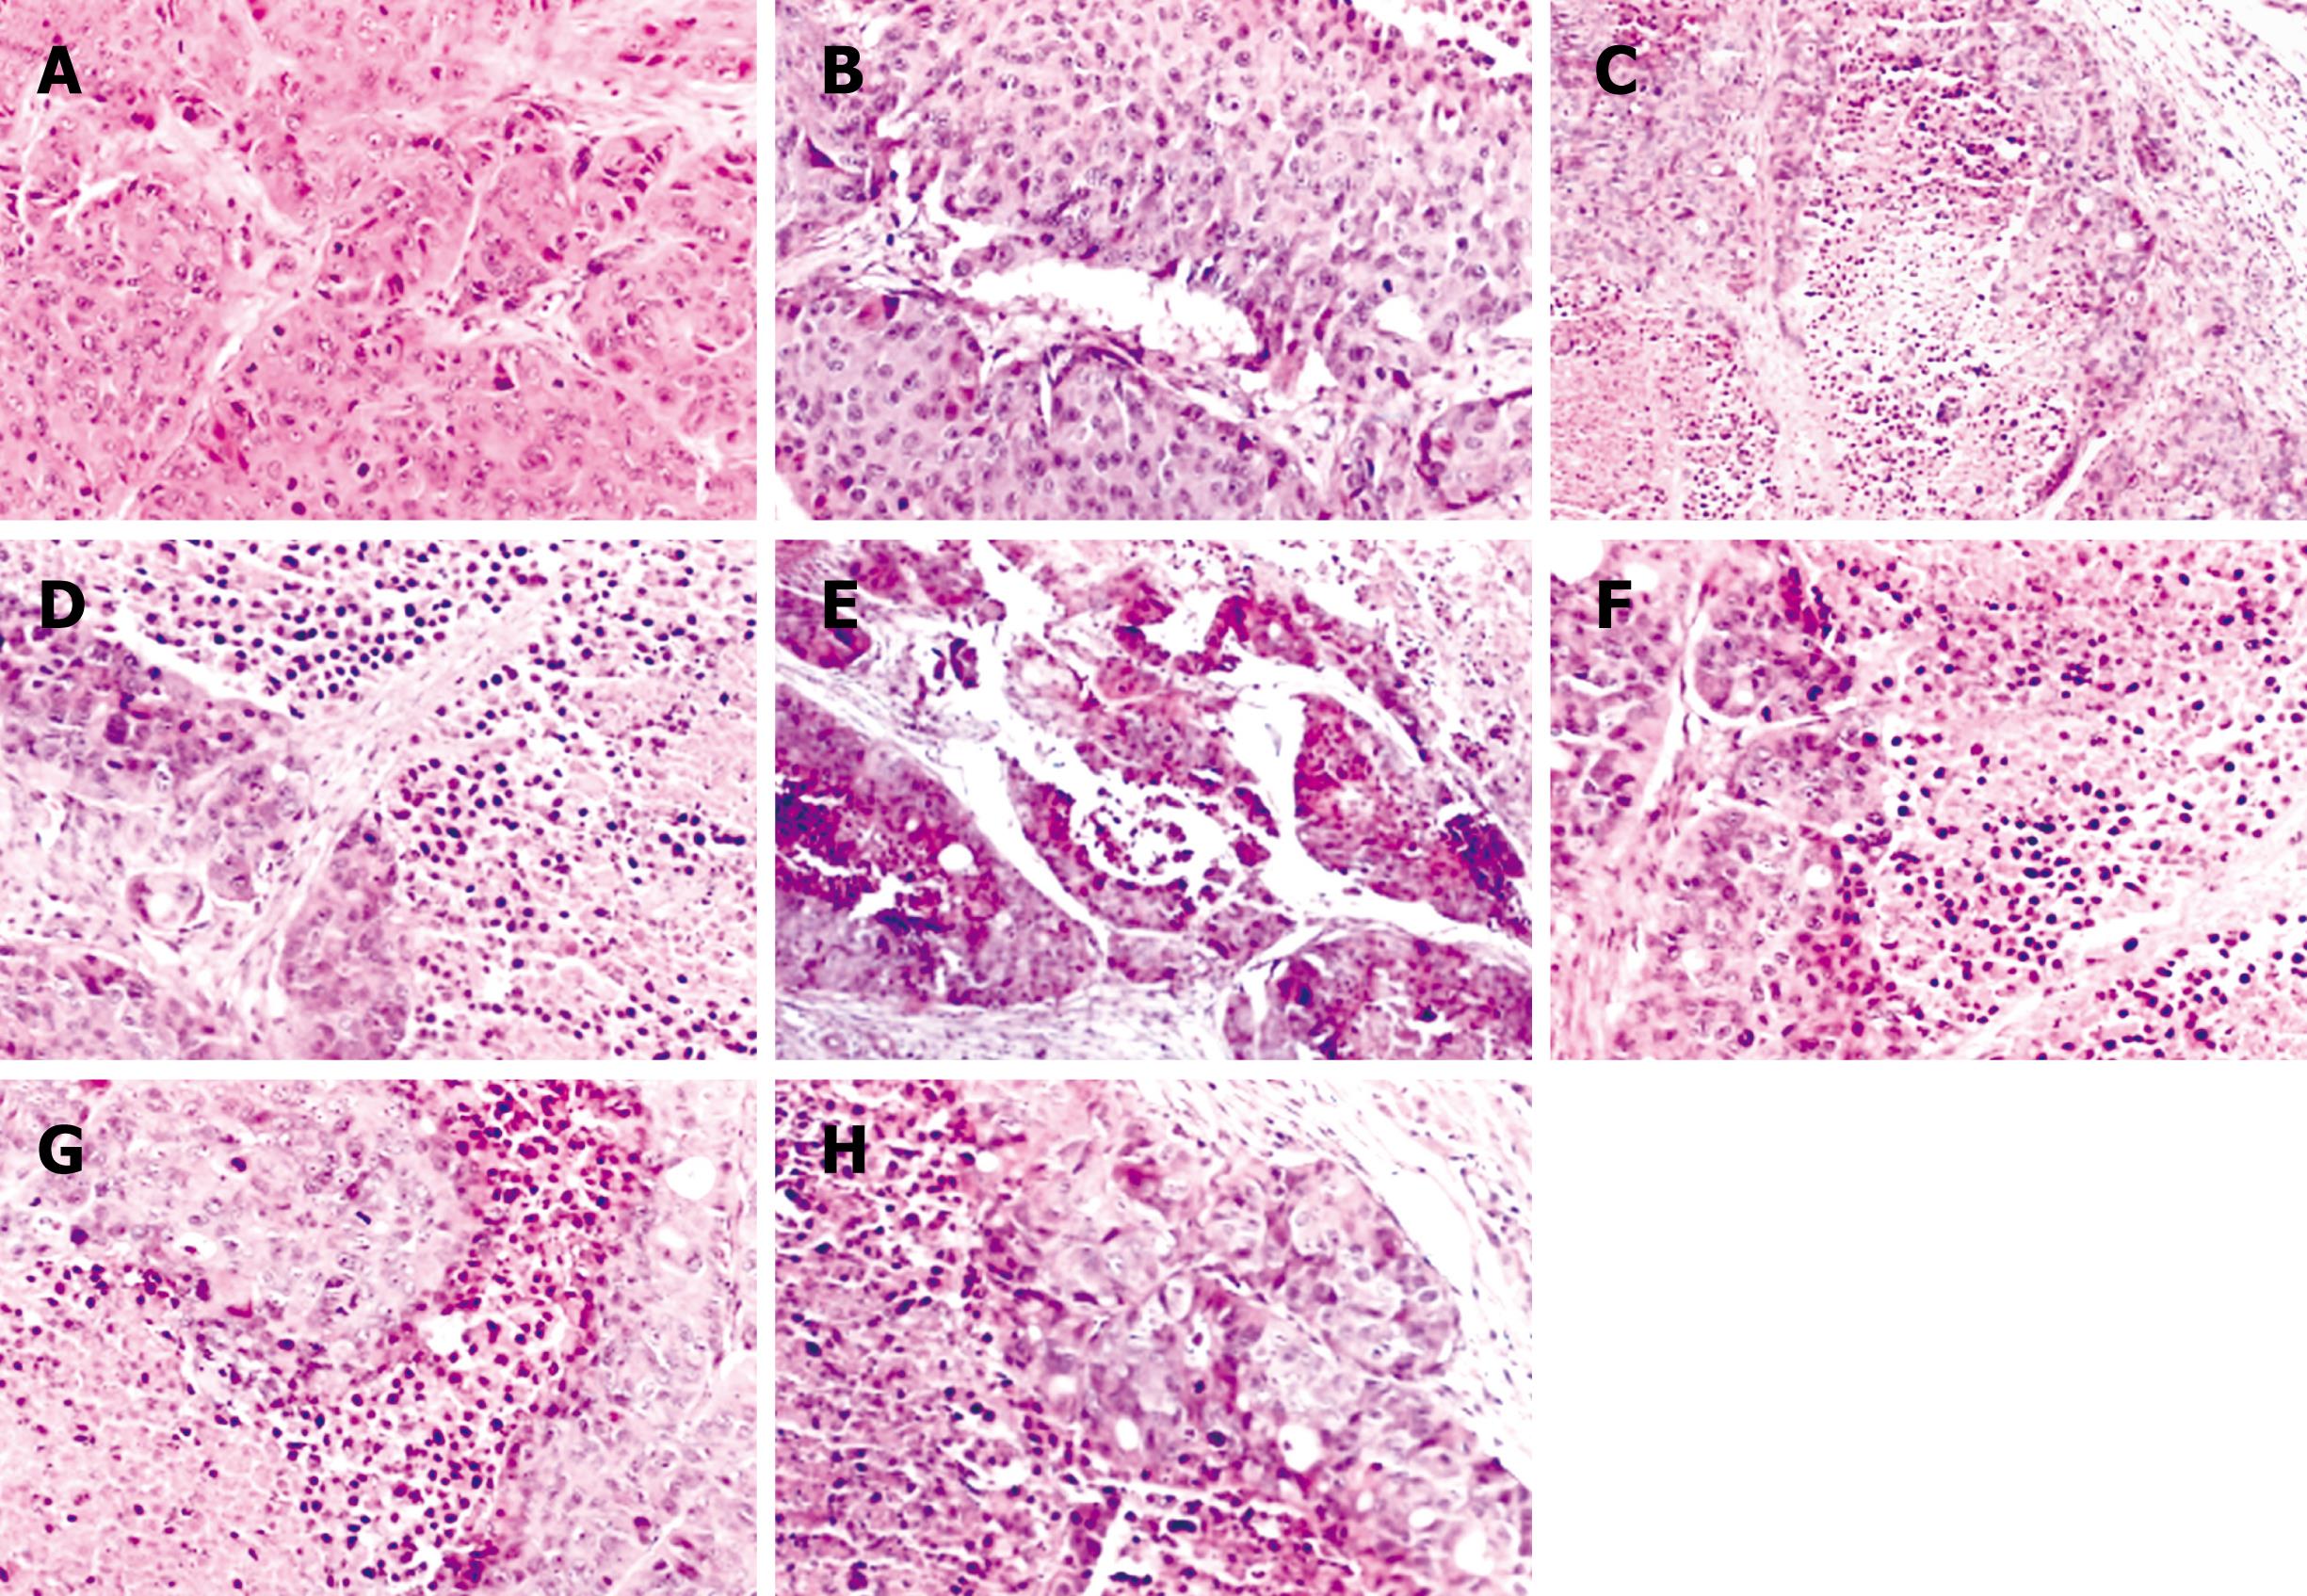
Figure 5 Histopathological analysis.
A: Tissue sections of the tumors from in situ xenograft HCC; B: Tissue sections of the tumors from nanoparticles; C: Tissue sections of the tumors from 5-FU (10 mg/kg per day); D: Tissue sections of the tumors treated with ASODNs 50 mg/kg per day; E-G: Tissue sections of tumors treated with NANO-ASODNs 100, 50 and 25 mg/kg per day of NANO-ASODN treated tumors, respectively; H: Tissue sections of the tumors treated with 5-FU (10 mg/kg per day) and 50 mg/kg per day of NANO-ASODNs. Regions showing an increase of necrosis and fibrosis were observed in the 5-FU or ASODN treatment groups (C-H, × 200) compared with the free nanoparticles and untreated groups (A and B, × 200).
-
Citation: Dai LC, Yao X, Wang X, Niu SQ, Zhou LF, Fu FF, Yang SX, Ping JL.
In vitro andin vivo suppression of hepatocellular carcinoma growth by midkine-antisense oligonucleotide-loaded nanoparticles. World J Gastroenterol 2009; 15(16): 1966-1972 - URL: https://www.wjgnet.com/1007-9327/full/v15/i16/1966.htm
- DOI: https://dx.doi.org/10.3748/wjg.15.1966


