Copyright
©2009 The WJG Press and Baishideng.
World J Gastroenterol. Apr 21, 2009; 15(15): 1829-1835
Published online Apr 21, 2009. doi: 10.3748/wjg.15.1829
Published online Apr 21, 2009. doi: 10.3748/wjg.15.1829
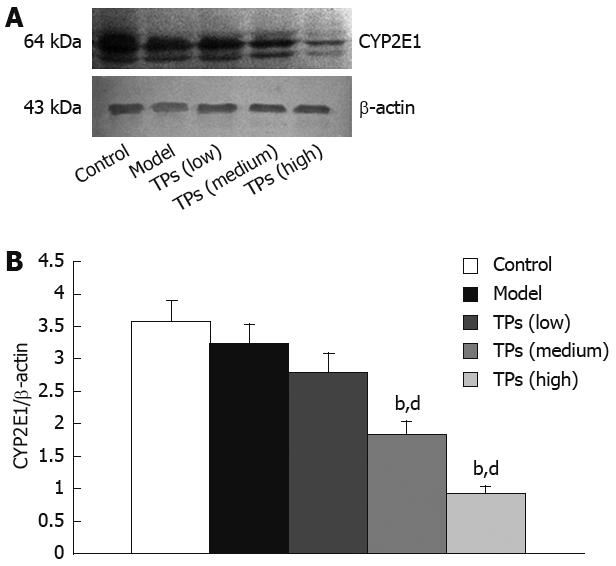
Figure 1 Western blot analysis of protein for CYP2E1 in liver tissue of mice showing representative bands of each group (A) and normalized densitometic ratios of CYP2E to β-actin (B).
bP < 0.01 vs control group; dP < 0.01 vs model group.
- Citation: Chen X, Sun CK, Han GZ, Peng JY, Li Y, Liu YX, Lv YY, Liu KX, Zhou Q, Sun HJ. Protective effect of tea polyphenols against paracetamol-induced hepatotoxicity in mice is significanly correlated with cytochrome P450 suppression. World J Gastroenterol 2009; 15(15): 1829-1835
- URL: https://www.wjgnet.com/1007-9327/full/v15/i15/1829.htm
- DOI: https://dx.doi.org/10.3748/wjg.15.1829


