Copyright
©2009 The WJG Press and Baishideng.
World J Gastroenterol. Mar 28, 2009; 15(12): 1431-1442
Published online Mar 28, 2009. doi: 10.3748/wjg.15.1431
Published online Mar 28, 2009. doi: 10.3748/wjg.15.1431
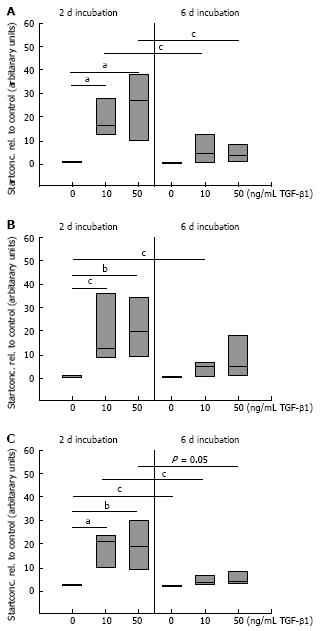
Figure 4 Quantitative mRNA analysis of FN (A) and the splicing forms FN ED-A (B) and FN ED-B (C) by real-time PCR in TGF stimulated CLPF.
TGF-β1 stimulated and untreated control-CLPF (n = 7) were lysed and mRNA was isolated. The cDNA start concentration of the untreated control group was set as 1. Compared to the control cells a dose-dependent increase in mRNA expression of FN, FN ED-A, and FN ED-B was determined. TGF-β1-stimulation for 2 d caused a higher increase in FN mRNA expression than after 6 d. Paired t-test: aP < 0.005; bP < 0.01; cP < 0.05.
- Citation: Brenmoehl J, Miller SN, Hofmann C, Vogl D, Falk W, Schölmerich J, Rogler G. Transforming growth factor-β1 induces intestinal myofibroblast differentiation and modulates their migration. World J Gastroenterol 2009; 15(12): 1431-1442
- URL: https://www.wjgnet.com/1007-9327/full/v15/i12/1431.htm
- DOI: https://dx.doi.org/10.3748/wjg.15.1431


