Copyright
©2009 The WJG Press and Baishideng.
World J Gastroenterol. Mar 21, 2009; 15(11): 1319-1330
Published online Mar 21, 2009. doi: 10.3748/wjg.15.1319
Published online Mar 21, 2009. doi: 10.3748/wjg.15.1319
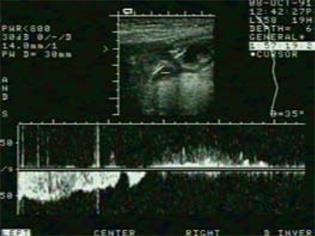
Figure 7 Scan of the transpyloric area with velocity curve of gastric emptying episode (left) and duodenogastric reflux episode (right).
Calibration bars indicate cm/s and 0.2 s on the y-axis and x-axis, respectively.
- Citation: Nylund K, Ødegaard S, Hausken T, Folvik G, Lied GA, Viola I, Hauser H, Gilja OH. Sonography of the small intestine. World J Gastroenterol 2009; 15(11): 1319-1330
- URL: https://www.wjgnet.com/1007-9327/full/v15/i11/1319.htm
- DOI: https://dx.doi.org/10.3748/wjg.15.1319


