Copyright
©2009 The WJG Press and Baishideng.
World J Gastroenterol. Mar 21, 2009; 15(11): 1319-1330
Published online Mar 21, 2009. doi: 10.3748/wjg.15.1319
Published online Mar 21, 2009. doi: 10.3748/wjg.15.1319
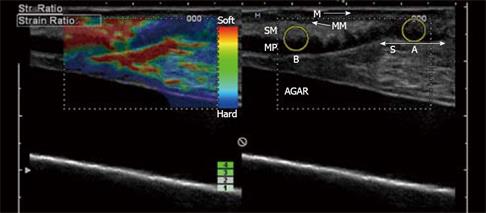
Figure 3 In vitro examination of a stenotic terminal ileum in a patient with CD.
The intestine has been cut open longitudinally and is resting on agar. The image was acquired with a 13-MHz linear probe (Hitachi Medical Systems Europe Holding AG, Zug, Switzerland) applied directly to the mucosa. The left image is an ordinary B-mode image showing the thickened GI wall (> 1 cm in vitro) with the muscularis propria (MP), submucosa (SM), mucosa (M) and a thickened muscularis mucosa (MM). Towards the stenosis (S), the stratification is lost. In the right corresponding elastography image, there is a clear transition between the blue (hard) stenotic area and the red (soft) pre-stenotic area. The strain measured in region A and B (yellow circles) differ with a ratio of 3.77 ( A: 0.27%; B: 1.02%; B/A: 3.77), which indicates a distinct difference in elasticity. Histology confirmed a fibrotic stenosis (Bar indicates 0.5 cm/unit).
- Citation: Nylund K, Ødegaard S, Hausken T, Folvik G, Lied GA, Viola I, Hauser H, Gilja OH. Sonography of the small intestine. World J Gastroenterol 2009; 15(11): 1319-1330
- URL: https://www.wjgnet.com/1007-9327/full/v15/i11/1319.htm
- DOI: https://dx.doi.org/10.3748/wjg.15.1319


