Copyright
©2008 The WJG Press and Baishideng.
World J Gastroenterol. Feb 14, 2008; 14(6): 918-924
Published online Feb 14, 2008. doi: 10.3748/wjg.14.918
Published online Feb 14, 2008. doi: 10.3748/wjg.14.918
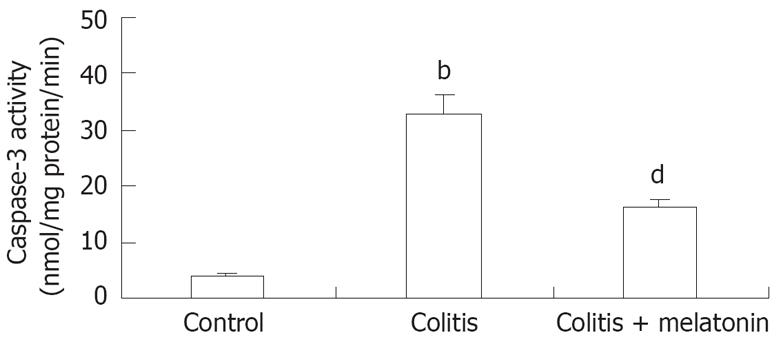
Figure 3 Colonic caspase-3 activity in all groups.
Vertical columns and error bars represent mean ± SD respectively. bP < 0.001 vs control group, dP < 0.01 vs colitis group.
- Citation: Akcan A, Kucuk C, Sozuer E, Esel D, Akyildiz H, Akgun H, Muhtaroglu S, Aritas Y. Melatonin reduces bacterial translocation and apoptosis in trinitrobenzene sulphonic acid-induced colitis of rats. World J Gastroenterol 2008; 14(6): 918-924
- URL: https://www.wjgnet.com/1007-9327/full/v14/i6/918.htm
- DOI: https://dx.doi.org/10.3748/wjg.14.918


