Copyright
©2008 The WJG Press and Baishideng.
World J Gastroenterol. Feb 7, 2008; 14(5): 731-736
Published online Feb 7, 2008. doi: 10.3748/wjg.14.731
Published online Feb 7, 2008. doi: 10.3748/wjg.14.731
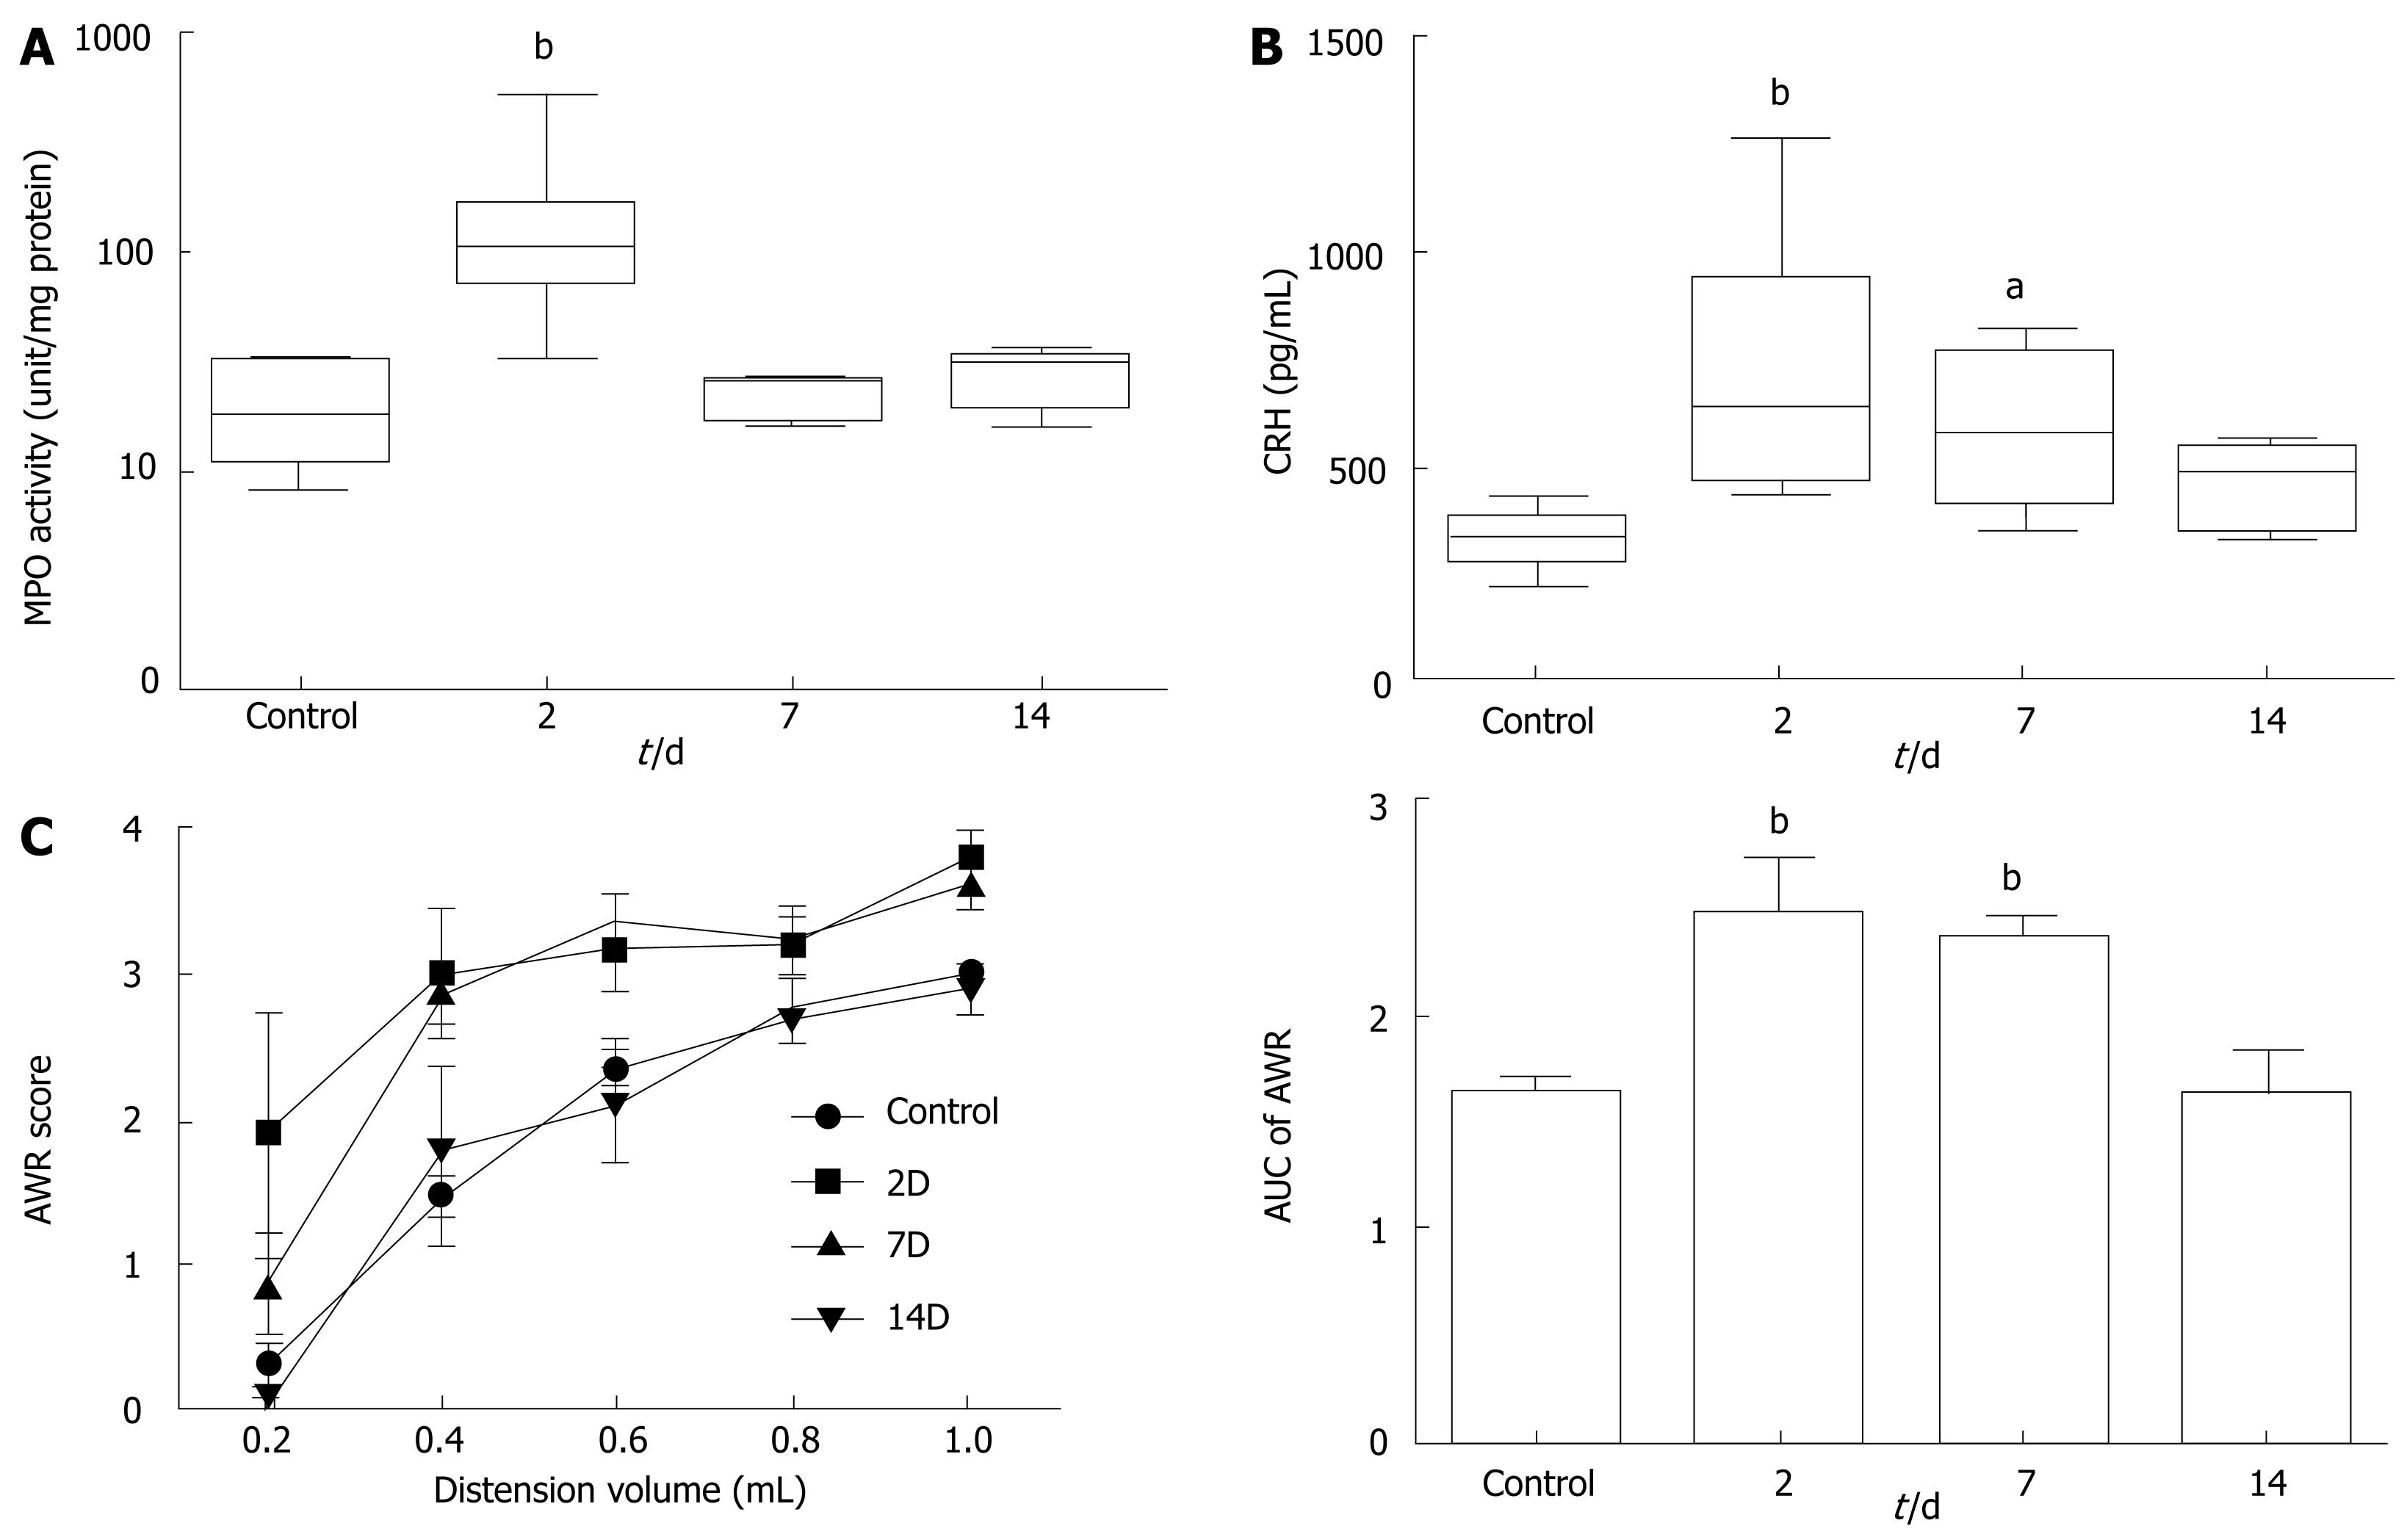
Figure 1 Colitis-induced changes in colonic mucosal MPO activity (A), plasma level of CRH (B), and visceral nociceptive AWR (C).
In panel A and B, the upper and lower whiskers indicate the maximum and minimum values, respectively. Box lines represent the 25th (bottom), 50th (middle) and 75th (top) percentile value; (C) The area under the curve (AUC) calculated from the stimulus-response plot is illustrated as a bar graph on the right side. aP < 0.05, bP < 0.01 vs control by MWU test after KW test (P < 0.01).
- Citation: La JH, Sung TS, Kim HJ, Kim TW, Kang TM, Yang IS. Peripheral corticotropin releasing hormone mediates post-inflammatory visceral hypersensitivity in rats. World J Gastroenterol 2008; 14(5): 731-736
- URL: https://www.wjgnet.com/1007-9327/full/v14/i5/731.htm
- DOI: https://dx.doi.org/10.3748/wjg.14.731


