Copyright
©2008 The WJG Press and Baishideng.
World J Gastroenterol. Dec 28, 2008; 14(48): 7335-7344
Published online Dec 28, 2008. doi: 10.3748/wjg.14.7335
Published online Dec 28, 2008. doi: 10.3748/wjg.14.7335
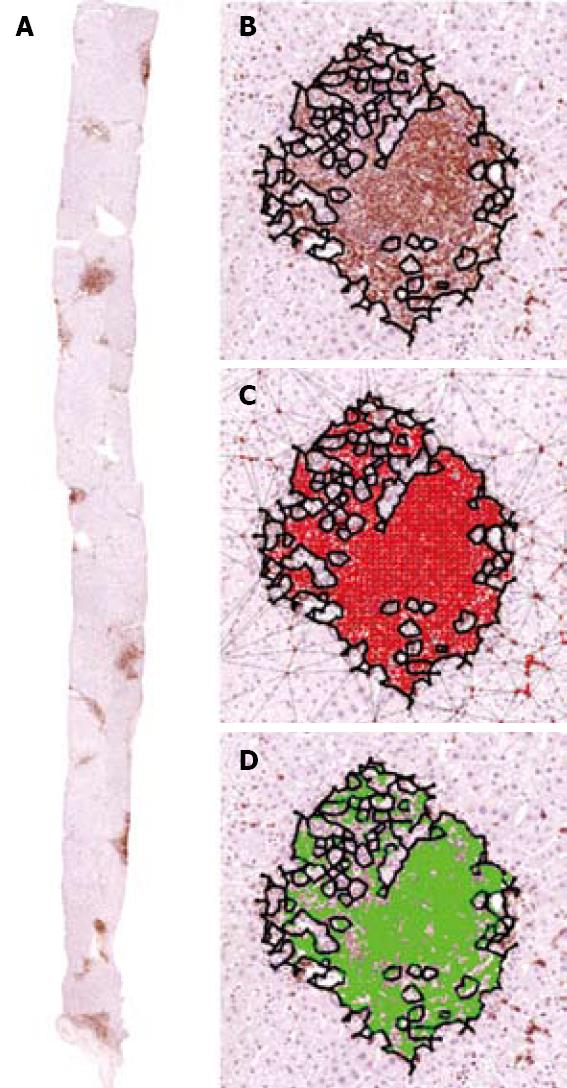
Figure 5 Liver inflammation (× 10).
A: Morphological picture showing the inflammatory cell’ clusters forming the inflammation basin; B: inflammatory cell cluster; C: discrimination of the cluster outline (black line) using the Delaunay’ triangulation; D: pure intra-cluster inflammatory space covered by the inflammation cell bodies (green surface). The immunological staining was performed by treating the sections with monoclonal antibodies raised against LCA.
- Citation: Dioguardi N, Grizzi F, Fiamengo B, Russo C. Metrically measuring liver biopsy: A chronic hepatitis B and C computer-aided morphologic description. World J Gastroenterol 2008; 14(48): 7335-7344
- URL: https://www.wjgnet.com/1007-9327/full/v14/i48/7335.htm
- DOI: https://dx.doi.org/10.3748/wjg.14.7335


