Copyright
©2008 The WJG Press and Baishideng.
World J Gastroenterol. Dec 28, 2008; 14(48): 7335-7344
Published online Dec 28, 2008. doi: 10.3748/wjg.14.7335
Published online Dec 28, 2008. doi: 10.3748/wjg.14.7335
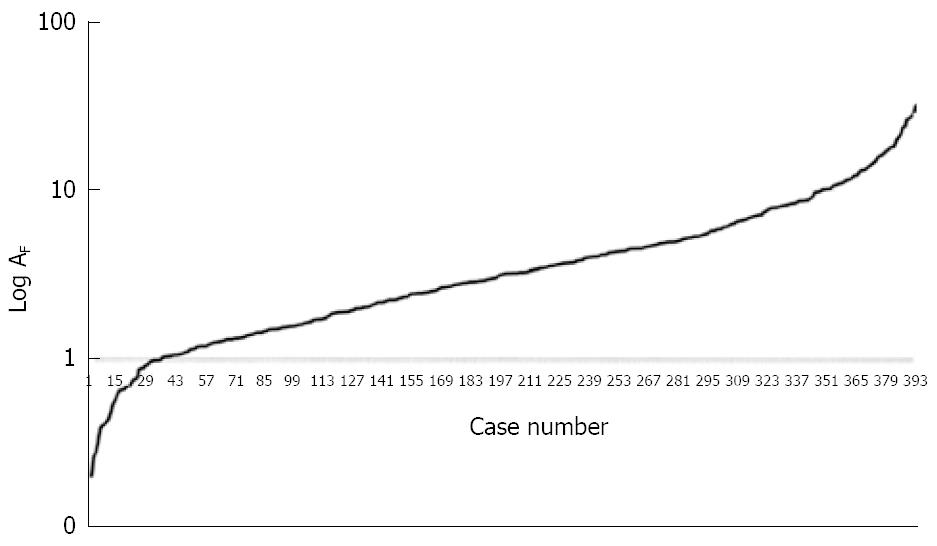
Figure 1 Markovian logarithmic curve obtained with the fibrosis content in each single biopsy section from 398 patients, ordered by increasing severity.
AF = area of fibrosis.
- Citation: Dioguardi N, Grizzi F, Fiamengo B, Russo C. Metrically measuring liver biopsy: A chronic hepatitis B and C computer-aided morphologic description. World J Gastroenterol 2008; 14(48): 7335-7344
- URL: https://www.wjgnet.com/1007-9327/full/v14/i48/7335.htm
- DOI: https://dx.doi.org/10.3748/wjg.14.7335


