Copyright
©2008 The WJG Press and Baishideng.
World J Gastroenterol. Dec 21, 2008; 14(47): 7240-7246
Published online Dec 21, 2008. doi: 10.3748/wjg.14.7240
Published online Dec 21, 2008. doi: 10.3748/wjg.14.7240
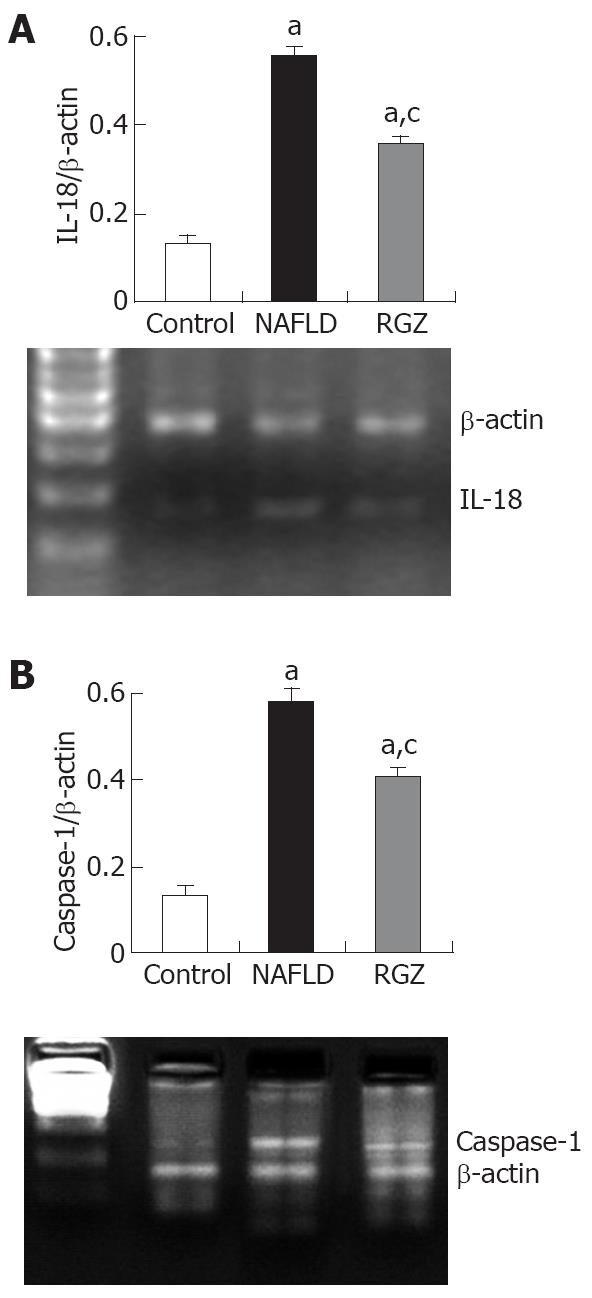
Figure 2 RT-PCR analysis of mRNA expression of IL-18 (A) and caspase-1 (B) in liver tissues of the three groups.
The histograms show the ratio of target gene expression to β-actin. Data are presented as mean ± SE from six independent experiments in the control group and eleven in the NAFLD and RGZ-treated NAFLD groups. aP < 0.05 vs control group, cP < 0.05 vs NAFLD group.
- Citation: Wang HN, Wang YR, Liu GQ, Liu Z, Wu PX, Wei XL, Hong TP. Inhibition of hepatic interleukin-18 production by rosiglitazone in a rat model of nonalcoholic fatty liver disease. World J Gastroenterol 2008; 14(47): 7240-7246
- URL: https://www.wjgnet.com/1007-9327/full/v14/i47/7240.htm
- DOI: https://dx.doi.org/10.3748/wjg.14.7240


