Copyright
©2008 The WJG Press and Baishideng.
World J Gastroenterol. Dec 7, 2008; 14(45): 6993-6998
Published online Dec 7, 2008. doi: 10.3748/wjg.14.6993
Published online Dec 7, 2008. doi: 10.3748/wjg.14.6993
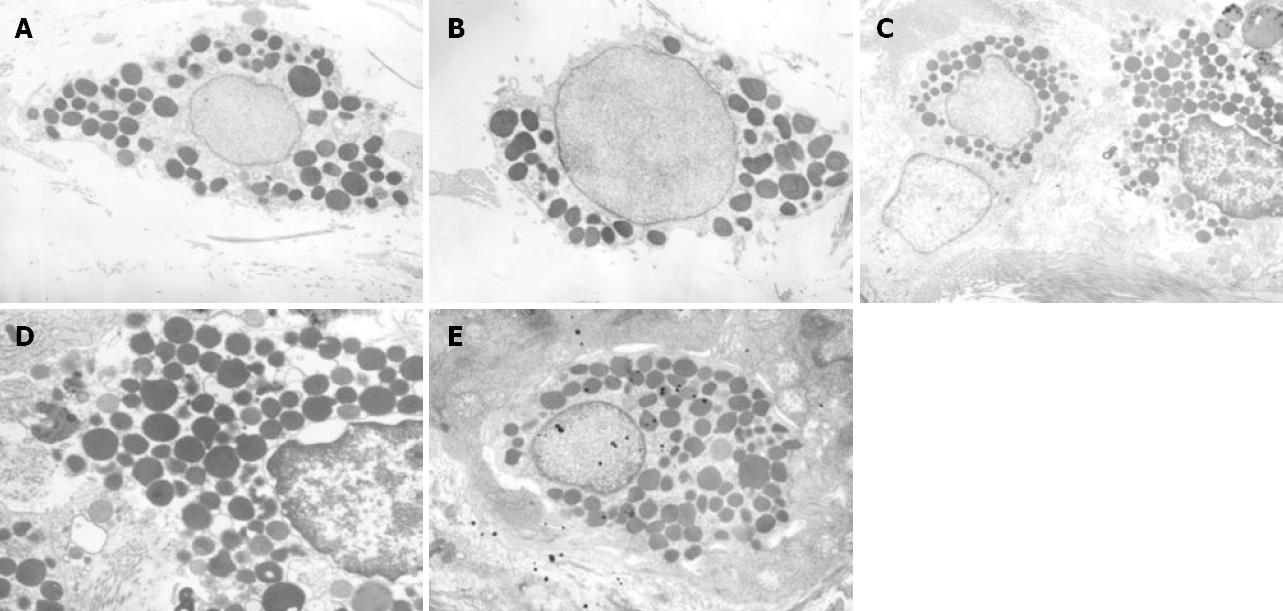
Figure 2 Electron photomicrographs of mast cells from the rat gastric antrum among groups.
A: A control group (× 4000); B: A fluoxetine + normal control group (× 4000); C: A depressed model group (× 4000); D: A saline + depressed model group (× 6000); E: A fluoxetine + control group (× 4000).
- Citation: Chen ZH, Xiao L, Chen JH, Luo HS, Wang GH, Huang YL, Wang XP. Effects of fluoxetine on mast cell morphology and protease-1 expression in gastric antrum in a rat model of depression. World J Gastroenterol 2008; 14(45): 6993-6998
- URL: https://www.wjgnet.com/1007-9327/full/v14/i45/6993.htm
- DOI: https://dx.doi.org/10.3748/wjg.14.6993


