Copyright
©2008 The WJG Press and Baishideng.
World J Gastroenterol. Nov 14, 2008; 14(42): 6506-6512
Published online Nov 14, 2008. doi: 10.3748/wjg.14.6506
Published online Nov 14, 2008. doi: 10.3748/wjg.14.6506
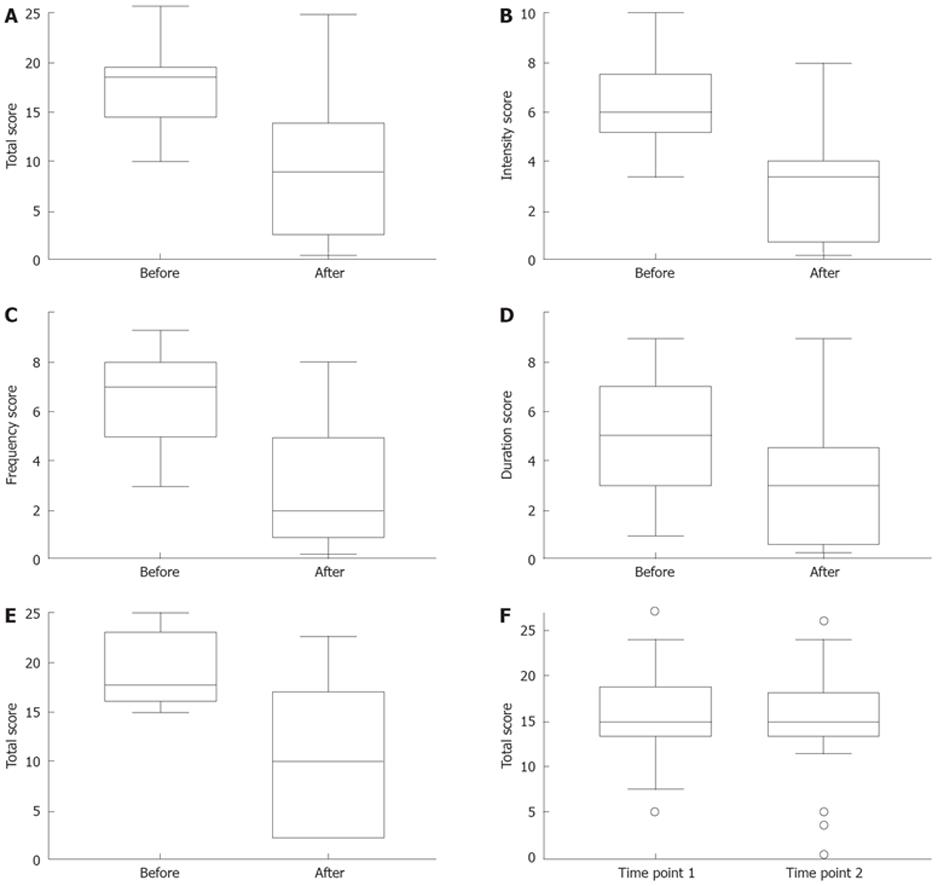
Figure 3 Results of the different group by graphical representation (parallel boxplot).
A: Total score; B: Intensity score; C: Frequency score; D: Duration score. The three symptom scores (B-D) are before and after treatment with pantoprazole in the study protocol group. There was statistically significant difference between the scores before and after therapy (P < 0.001 for all four scores). E: Graphical representation (parallel boxplot) of the total score before and after treatment in the external PPI group. The total score after treatment was significantly different compared to the total score before treatment (P = 0.0011); F: Graphical representation (parallel boxplot) of the total score before and after an observation period of 8 wk in the control group. There was no significant difference between the scores before and after the observation period (P = 0.2448).
- Citation: Dietrich CG, Laupichler S, Stanzel S, Winograd R, Al-Taie O, Gartung C, Geier A. Origin of and therapeutic approach to cardiac syndrome X: Results of the proton pump inhibitor therapy for angina-like lingering pain trial (PITFALL trial). World J Gastroenterol 2008; 14(42): 6506-6512
- URL: https://www.wjgnet.com/1007-9327/full/v14/i42/6506.htm
- DOI: https://dx.doi.org/10.3748/wjg.14.6506


