Copyright
©2008 The WJG Press and Baishideng.
World J Gastroenterol. Nov 14, 2008; 14(42): 6496-6502
Published online Nov 14, 2008. doi: 10.3748/wjg.14.6496
Published online Nov 14, 2008. doi: 10.3748/wjg.14.6496
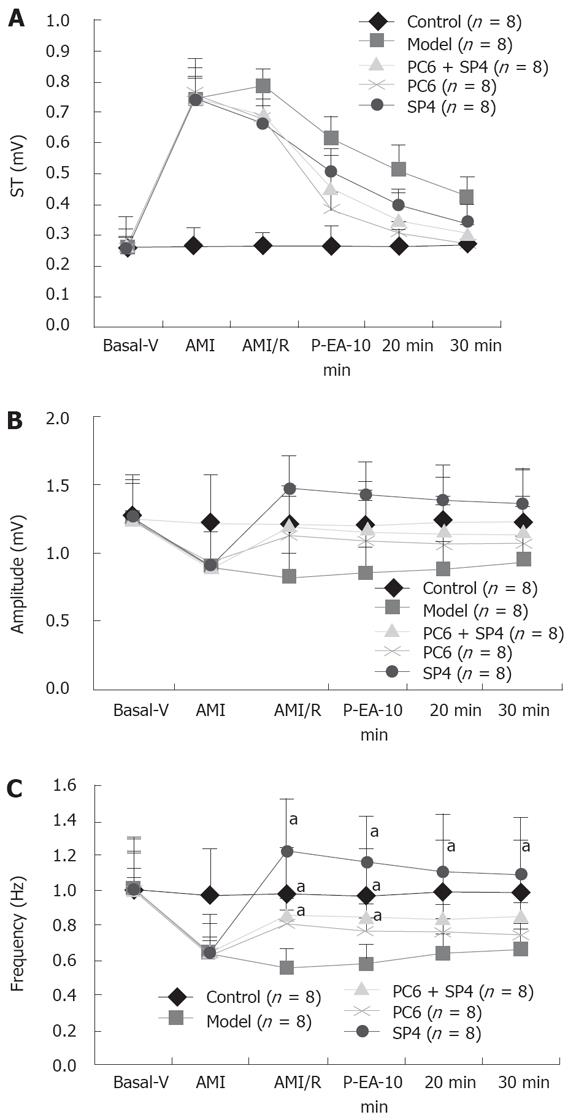
Figure 1 Changes in rabbit ECG-ST (mV, A), amplitude (mV, B) and frequency (pulses/s, C) of slow waves of electrogastrogram (EGG) in control, model, PC6, SP4 and PC6 + SP4 groups (n = 8 in each group) at different courses after acute myocardial ischemia and reperfusion (AMI/R).
aP < 0.05 vs model group; Basal-V: Basal value; P-EA: Post-EA.
- Citation: Wang SB, Chen SP, Gao YH, Luo MF, Liu JL. Effects of electroacupuncture on cardiac and gastric activities in acute myocardial ischemia rats. World J Gastroenterol 2008; 14(42): 6496-6502
- URL: https://www.wjgnet.com/1007-9327/full/v14/i42/6496.htm
- DOI: https://dx.doi.org/10.3748/wjg.14.6496


