Copyright
©2008 The WJG Press and Baishideng.
World J Gastroenterol. Nov 14, 2008; 14(42): 6473-6480
Published online Nov 14, 2008. doi: 10.3748/wjg.14.6473
Published online Nov 14, 2008. doi: 10.3748/wjg.14.6473
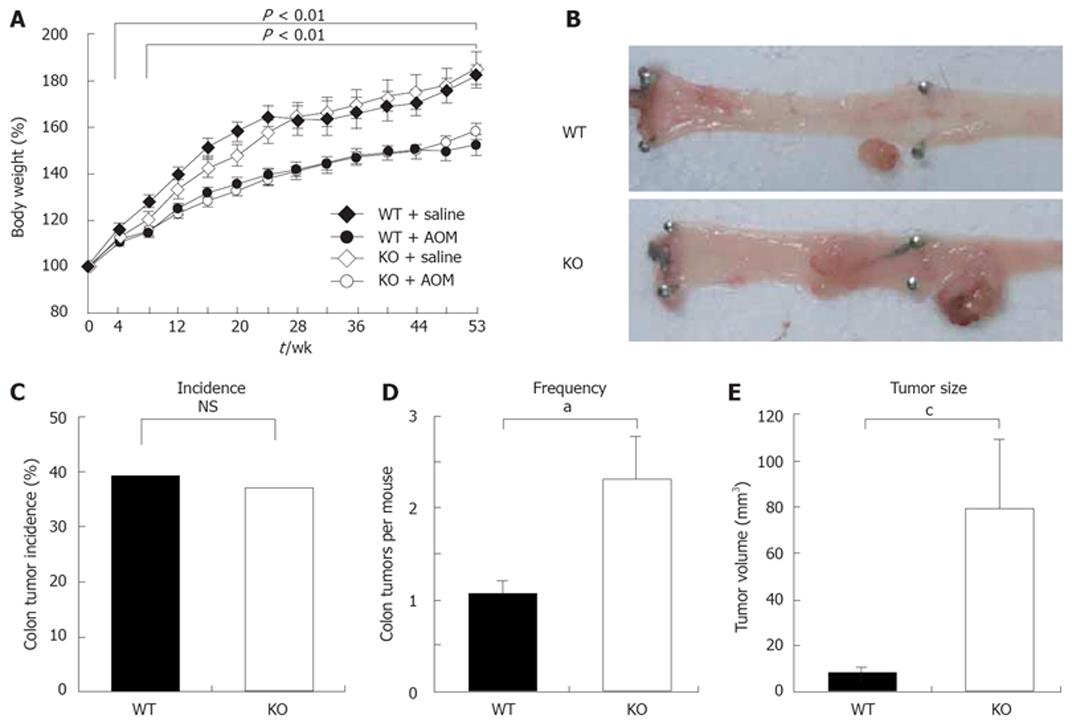
Figure 1 Enhanced AOM-induced colorectal carcinogenesis in KO mice.
A: Changes in percentage of body weight. P < 0.01, between WT + saline (n = 9) and WT + AOM (n = 23). P < 0.001, between KO + saline (n = 13) and KO + AOM (n = 24); B: Representative pictures of the colorectal tumors arising in WT and KO mice after AOM treatment; C: Tumor incidence is expressed as the ratio of mice with tumor/total number of mice (NS: Not statistically significant; χ2 test); D: Tumor frequency. WT, n = 9; KO, n = 9 (aP < 0.05, Student’s t-test); E: Tumor size. WT, n = 9; KO, n = 19 (cP < 0.05, Student’s t-test). Results are presented as mean ± SE.
- Citation: Nishihara T, Baba M, Matsuda M, Inoue M, Nishizawa Y, Fukuhara A, Araki H, Kihara S, Funahashi T, Tamura S, Hayashi N, Iishi H, Shimomura I. Adiponectin deficiency enhances colorectal carcinogenesis and liver tumor formation induced by azoxymethane in mice. World J Gastroenterol 2008; 14(42): 6473-6480
- URL: https://www.wjgnet.com/1007-9327/full/v14/i42/6473.htm
- DOI: https://dx.doi.org/10.3748/wjg.14.6473


