Copyright
©2008 The WJG Press and Baishideng.
World J Gastroenterol. Nov 14, 2008; 14(42): 6444-6452
Published online Nov 14, 2008. doi: 10.3748/wjg.14.6444
Published online Nov 14, 2008. doi: 10.3748/wjg.14.6444
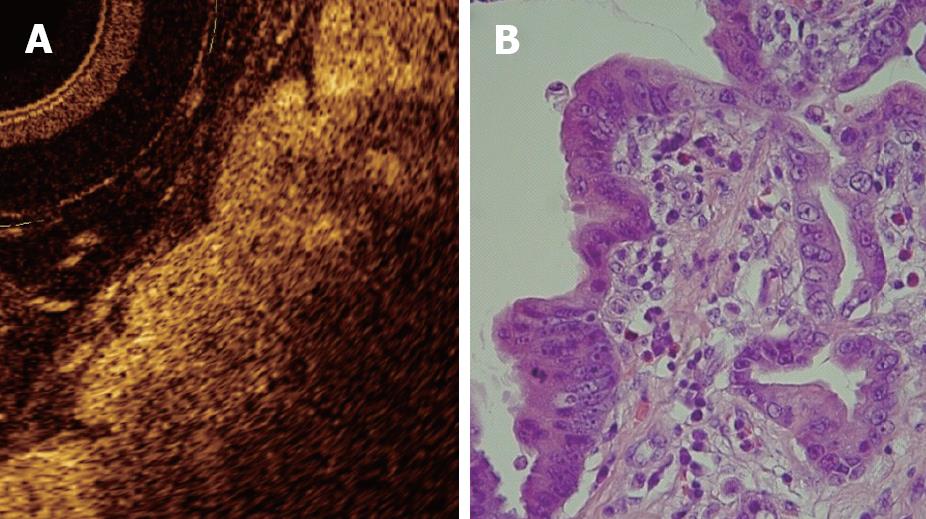
Figure 7 OCT image showing high-grade dysplasia (A) compared to histology (B).
Because the degree of reflectivity depends upon nuclear size, a markedly inhomogenous and hypo-reflective back-scattering of the signal should indicate the presence of high-grade dysplasia.
- Citation: Testoni PA, Mangiavillano B. Optical coherence tomography in detection of dysplasia and cancer of the gastrointestinal tract and bilio-pancreatic ductal system. World J Gastroenterol 2008; 14(42): 6444-6452
- URL: https://www.wjgnet.com/1007-9327/full/v14/i42/6444.htm
- DOI: https://dx.doi.org/10.3748/wjg.14.6444


