Copyright
©2008 The WJG Press and Baishideng.
World J Gastroenterol. Nov 7, 2008; 14(41): 6355-6359
Published online Nov 7, 2008. doi: 10.3748/wjg.14.6355
Published online Nov 7, 2008. doi: 10.3748/wjg.14.6355
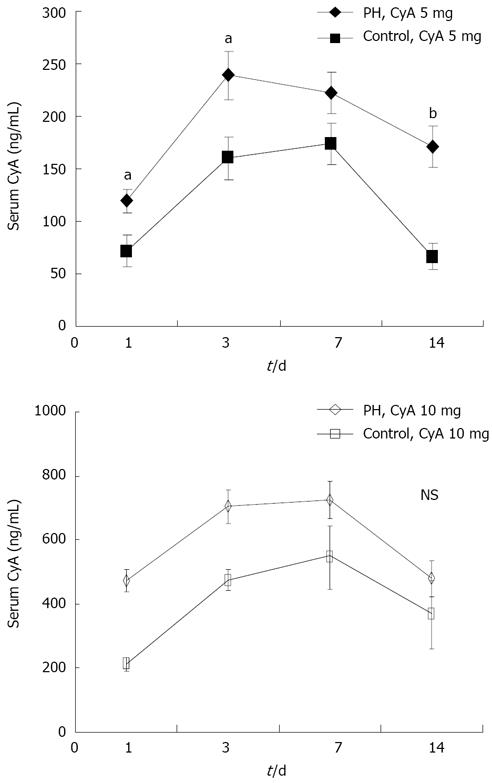
Figure 2 Changes in the serum concentration of CyA during liver regeneration.
The values are expressed as the mean ± SD of 5 samples in each group. The concentration of CyA reached a maximum during 3 to 7 d, and gradually declined thereafter. The level of CyA in the PH group was significantly higher than that in control group. aP < 0.05, bP < 0.01.
- Citation: Nagayoshi S, Kawashita Y, Eguchi S, Kamohara Y, Takatsuki M, Miyamoto S, Mochizuki S, Soyama A, Tokai H, Hidaka M, Tajima Y, Kanematsu T. Metabolism for cyclosporin A during liver regeneration after partial hepatectomy in rats. World J Gastroenterol 2008; 14(41): 6355-6359
- URL: https://www.wjgnet.com/1007-9327/full/v14/i41/6355.htm
- DOI: https://dx.doi.org/10.3748/wjg.14.6355


