Copyright
©2008 The WJG Press and Baishideng.
World J Gastroenterol. Nov 7, 2008; 14(41): 6339-6346
Published online Nov 7, 2008. doi: 10.3748/wjg.14.6339
Published online Nov 7, 2008. doi: 10.3748/wjg.14.6339
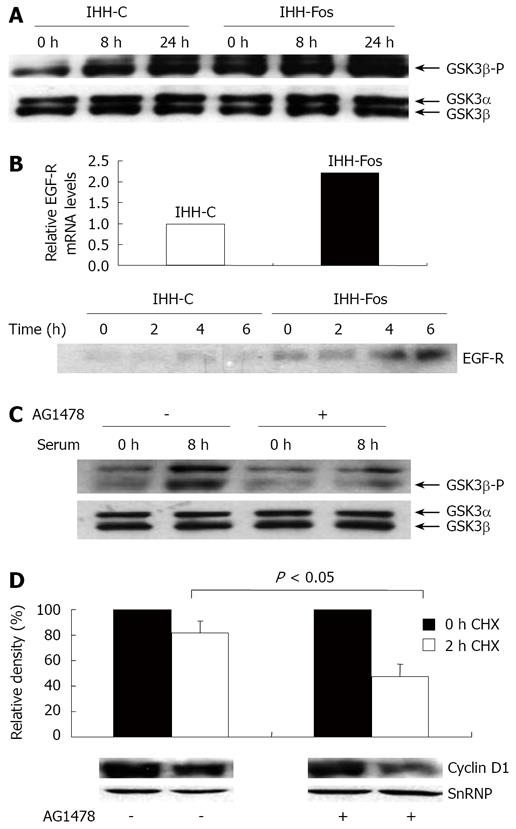
Figure 4 Stimulation of EGF-R signaling by c-Fos overexpression.
A: Total and phosphorylated levels of nuclear GSK-β. IHH-C or IHH-Fos were serum starved for 24 h. Nuclear extracts prepared from unstimulated (0 h), 8 h or 24 h serum stimulated IHH-C or IHH-Fos, were immunoblotted with an antibody against phosphorylated or total GSK3β. B: Upper panel, detection of EGF-R mRNA in IHH-C and IHH-Fos by quantitative real time PCR analysis of mRNA isolated from cells grown in the presence of serum. Lower panel, Western blot analysis of EGF-R in total cell extracts from IHH-C and IHH-Fos cells serum starved for 24 h (0) or stimulated with serum for the indicated times; C: Serum deprived IHH-Fos were pre-treated (+) or not (-) with AG1478 (10 μmol/L) for 1 h. Nuclear proteins were prepared from non stimulated and 8 h serum-stimulated cells. Phosphorylated and total GSK3β levels were detected by Western blot; D: Serum-deprived IHH-Fos were pretreated or not with AG1478 (10 μmol/L) for 1 h, then serum-stimulated for 6 h. Nuclear proteins were extracted before (0 h, filled columns) or after 2 h (empty columns) of CHX treatment (30 µg/mL). Cyclin D1 levels were quantified by Western blotting. The immunoreactive bands were quantified by densitometric analysis after loading normalization of the blot using a SnRNP antibody. The results are expressed as the % of Cyclin D1/SnRNP expression and are the mean ± SE of 3 independent experiments. The lower panel illustrates one representative experiment.
- Citation: Güller M, Toualbi-Abed K, Legrand A, Michel L, Mauviel A, Bernuau D, Daniel F. c-Fos overexpression increases the proliferation of human hepatocytes by stabilizing nuclear Cyclin D1. World J Gastroenterol 2008; 14(41): 6339-6346
- URL: https://www.wjgnet.com/1007-9327/full/v14/i41/6339.htm
- DOI: https://dx.doi.org/10.3748/wjg.14.6339


