Copyright
©2008 The WJG Press and Baishideng.
World J Gastroenterol. Nov 7, 2008; 14(41): 6339-6346
Published online Nov 7, 2008. doi: 10.3748/wjg.14.6339
Published online Nov 7, 2008. doi: 10.3748/wjg.14.6339
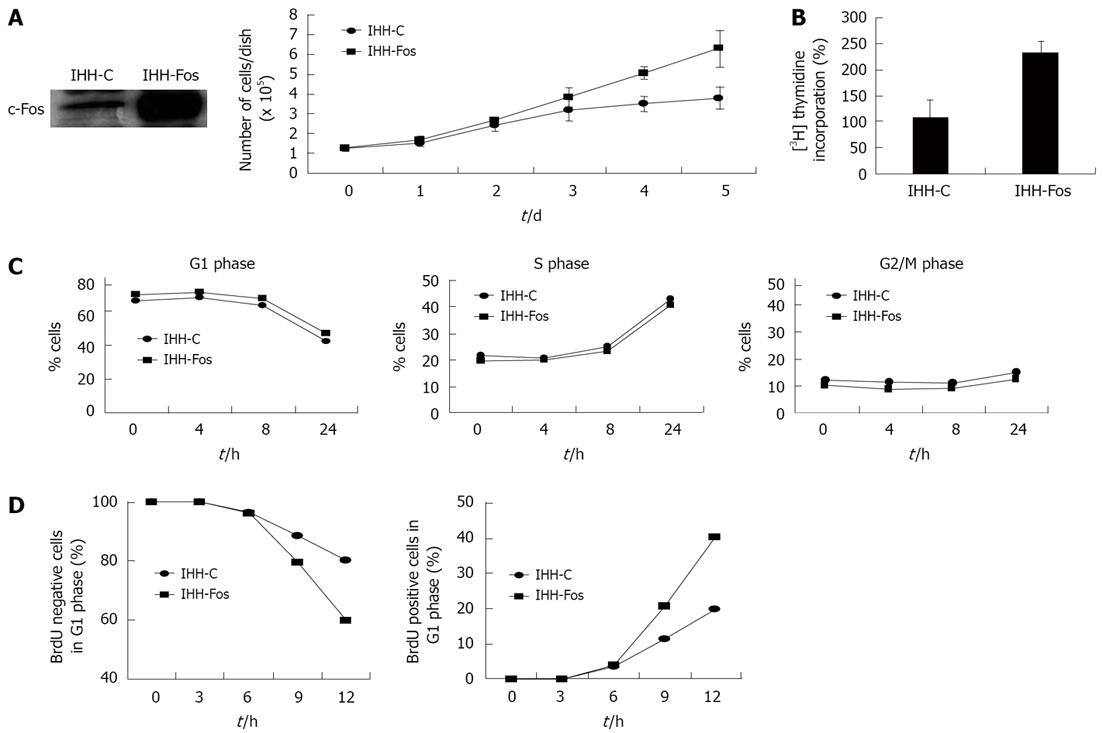
Figure 1 Overexpression of c-Fos accelerates the cell cycle.
A: IHH-C and IHH-Fos were grown in 1% FCS, cultured for 5 d and counted daily. Cell growth was determined by counting the number of attached cells every day. Results are the mean ± SE of three independent experiments; B: [3H] thymidine incorporation into DNA. Non-synchronized IHH-C or IHH-Fos serum starved for 24 h then serum stimulated for 4 h were incubated with [3H] thymidine for 4 h. DNA was extracted as described in materials and methods, and [3H] thymidine incorporation into DNA was assessed by scintillation counting. Results are expressed as percentage of increase of [3H] thymidine incorporation in serum-stimulated cells over that of quiescent cells for each cell population. Results are the mean ± SE of six independent experiments; C: Flow cytometry analysis for quantification of cell cycle phase distribution and progression through cell cycle. IHH-C or IHH-Fos serum starved for 24 h were incubated with BrdU for 1 h and stained with propidium iodide 0, 4, 8 and 24 h after serum stimulation. The percentage of cells in each phase is plotted against time. Results of a representative experiment are shown (out of 3); D: IHH-C or IHH-Fos serum starved for 24 h were serum stimulated for 12 h, BrdU pulsed for 1 h, chased with fresh medium for 0, 3, 6, 9, 12 h, and then stained with propidium iodide. The percentage of BrdU-negative cells in the G1 phase (G1 exit) (left panel) and of the BrdU-positive cells in the G1 phase (G1 entry) (right panel) of the cell cycle is plotted against time. Results are representative of four independent experiments.
- Citation: Güller M, Toualbi-Abed K, Legrand A, Michel L, Mauviel A, Bernuau D, Daniel F. c-Fos overexpression increases the proliferation of human hepatocytes by stabilizing nuclear Cyclin D1. World J Gastroenterol 2008; 14(41): 6339-6346
- URL: https://www.wjgnet.com/1007-9327/full/v14/i41/6339.htm
- DOI: https://dx.doi.org/10.3748/wjg.14.6339


