Copyright
©2008 The WJG Press and Baishideng.
World J Gastroenterol. Oct 28, 2008; 14(40): 6188-6194
Published online Oct 28, 2008. doi: 10.3748/wjg.14.6188
Published online Oct 28, 2008. doi: 10.3748/wjg.14.6188
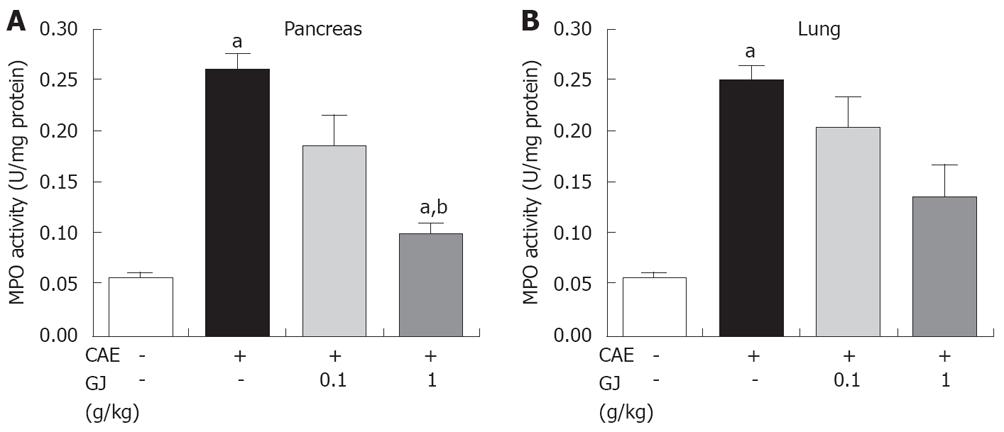
Figure 6 MPO activity was measured in the pancreas 6 h after completion of the cerulein injections and in saline-injected control mice (CON).
The data are expressed as MPO activity (U/mg protein). aP < 0.05 vs saline treatment; bP < 0.05 vs cerulein treatment alone. The figure shows the results of one experiment in which 5-6 mice were tested per group.
-
Citation: Jung WS, Chae YS, Kim DY, Seo SW, Park HJ, Bae GS, Kim TH, Oh HJ, Yun KJ, Park RK, Kim JS, Kim EC, Hwang SY, Park SJ, Song HJ.
Gardenia jasminoides protects against cerulein-induced acute pancreatitis. World J Gastroenterol 2008; 14(40): 6188-6194 - URL: https://www.wjgnet.com/1007-9327/full/v14/i40/6188.htm
- DOI: https://dx.doi.org/10.3748/wjg.14.6188


