Copyright
©2008 The WJG Press and Baishideng.
World J Gastroenterol. Jan 28, 2008; 14(4): 541-546
Published online Jan 28, 2008. doi: 10.3748/wjg.14.541
Published online Jan 28, 2008. doi: 10.3748/wjg.14.541
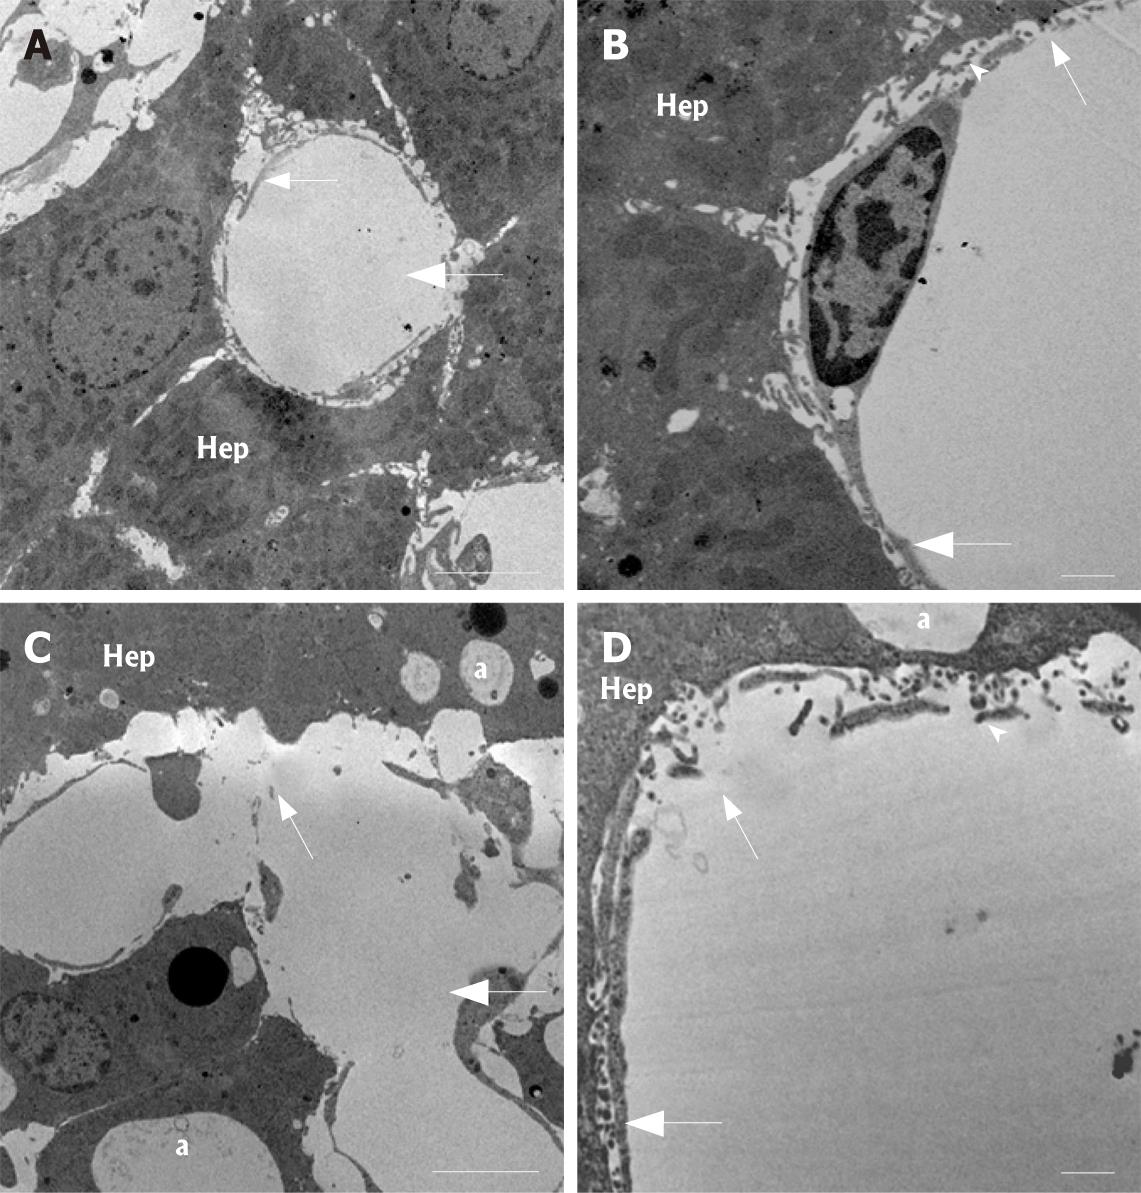
Figure 4 Transmission electron micrographs of control (A and B) and kavain-treated livers (C and D).
Note, comparisons of these high-resolution TEM data with the corresponding low-magnification light microscopy images. A: Intermediate magnification reveals the intact histological relationship between the liver sinusoidal endothelium (small arrow) and the neighbouring liver parenchymal cells (Hep) of control liver tissue. Note the lumen (large arrow) of the small liver capillaries, also called the liver sinusoids. Scale bar, 5 micrometer; B: Examination of control samples at higher magnification reveals the intact endothelial lining (large arrow) containing the typical small transportation pores (fenestrae) (small arrow). Hep, hepatocytes; arrowhead, the space of Disse (defined as the space between the endothelial processes and the hepatocytes). Scale bar, 1 micrometer; C: Kavain-treated liver tissue samples at intermediate magnification shows strong signs of vacuolization of the hepatic tissue (a), sinusoidal endothelial damage (small arrow). Large arrow, liver sinusoids; Hep, hepatocytes or liver parenchymal cells. Scale bar, 5 micrometer; D: High magnification of liver tissue of kavain-treated rats confirm the earlier SEM observations with respect to large gap formation of the endothelial lining (small arrow). Large arrow, sinusoids; arrowhead, space of Disse; asterisk, vacuolization. Scale bar, 1 micrometer.
- Citation: Fu S, Korkmaz E, Braet F, Ngo Q, Ramzan I. Influence of kavain on hepatic ultrastructure. World J Gastroenterol 2008; 14(4): 541-546
- URL: https://www.wjgnet.com/1007-9327/full/v14/i4/541.htm
- DOI: https://dx.doi.org/10.3748/wjg.14.541


