Copyright
©2008 The WJG Press and Baishideng.
World J Gastroenterol. Jan 28, 2008; 14(4): 541-546
Published online Jan 28, 2008. doi: 10.3748/wjg.14.541
Published online Jan 28, 2008. doi: 10.3748/wjg.14.541
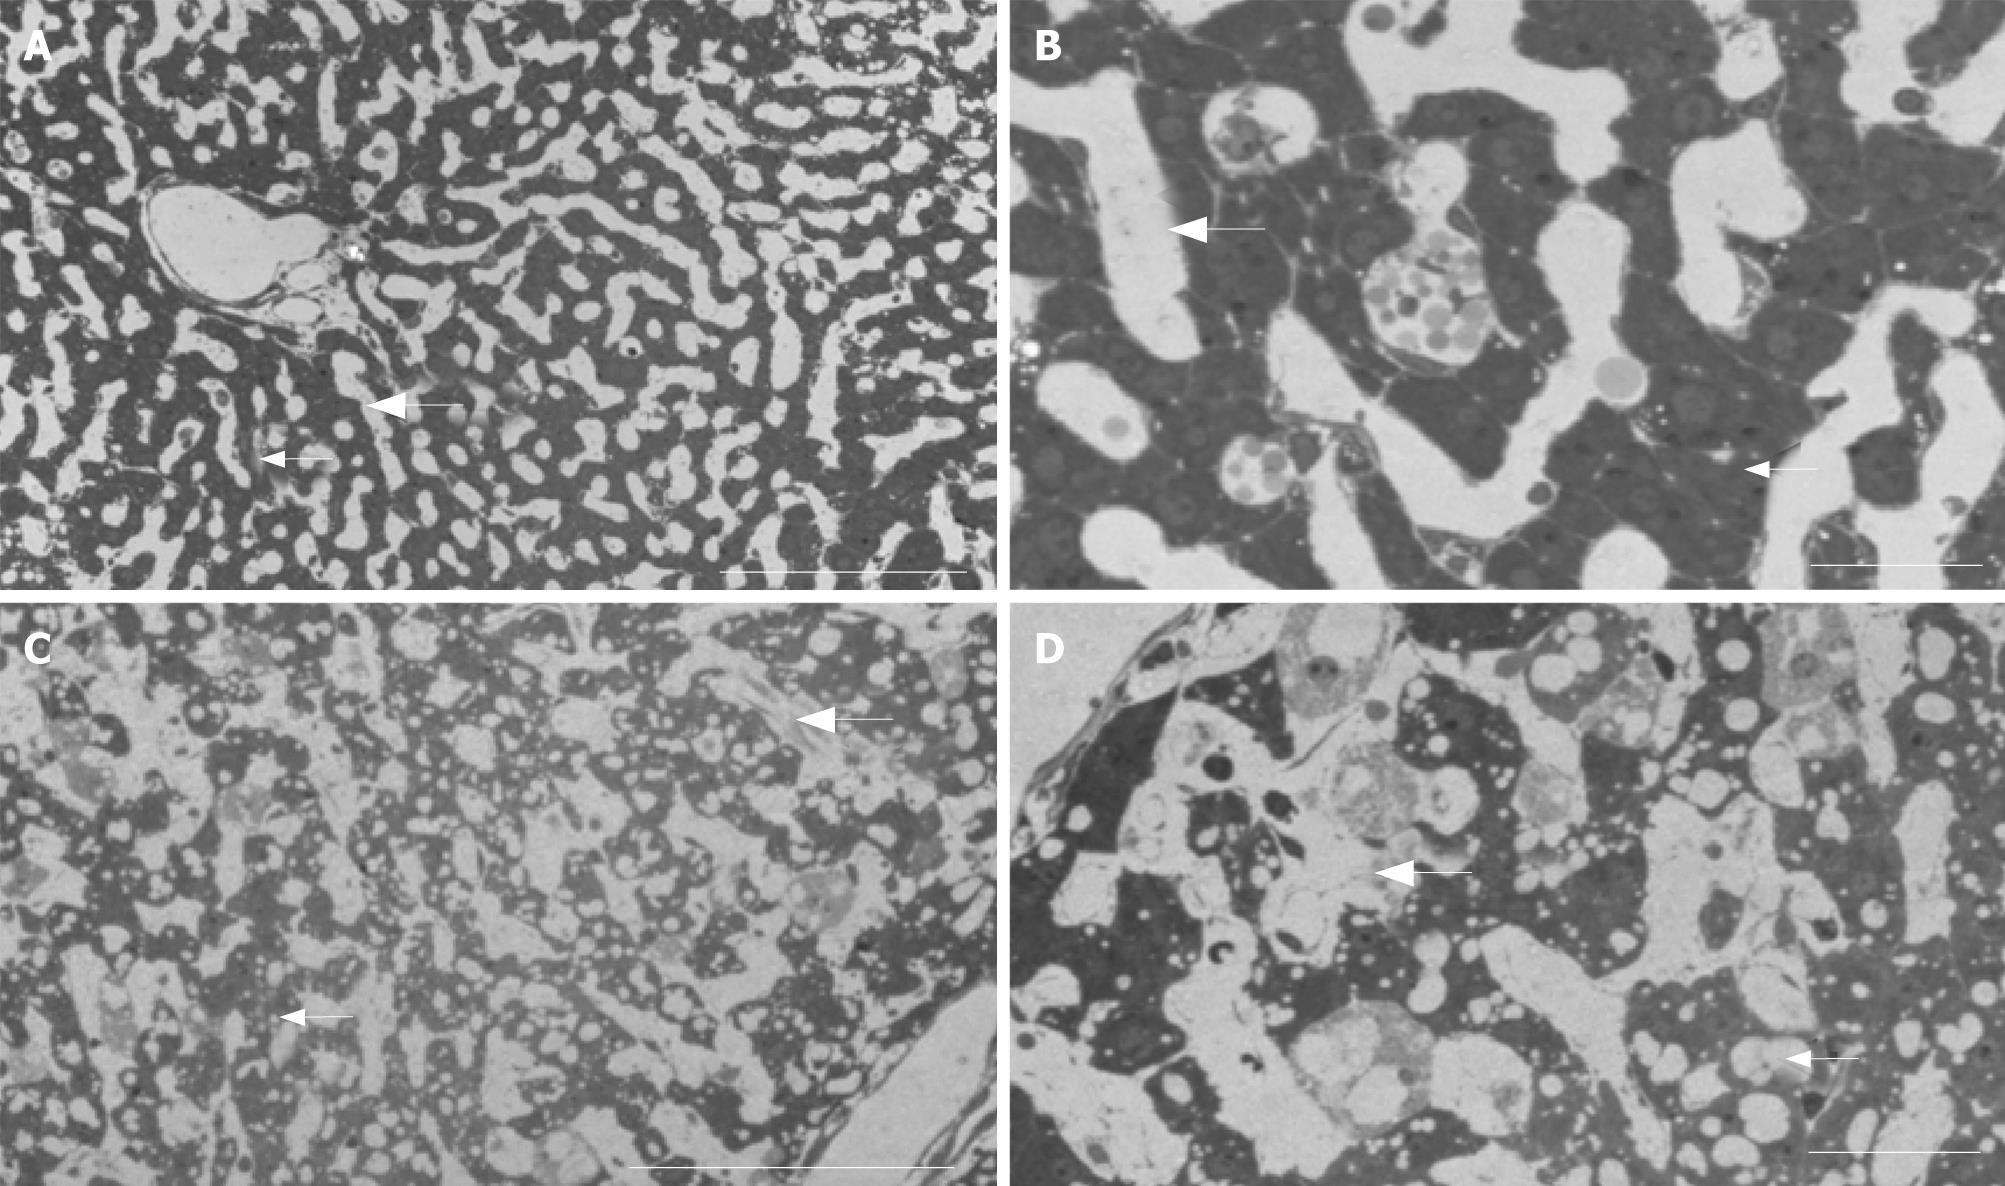
Figure 3 Bright field light optical micrographs of control (A and B) and kavain-treated livers (C and D).
Note, comparison with the high-magnification TEM data for comparative purposes. A: Control liver tissue at low magnification reveals normal histology: i.e., hepatocytes (small arrow) are organized in long cords following the liver sinusoids or microvascular bed (large arrow). Scale bar, 100 micrometer; B: Higher magnification of control tissue reveals the patent empty sinusoidal lumen (large arrow) and the relationship with the neighbouring hepatocytes (small arrow). Scale bar 40 micrometer; C: In contrast, kavain-treated samples reveal narrowing of the microvessels (large arrow), indicating sinusoidal blood vessel contraction (compare with A). Small arrow, hepatocytes. Scale bar, 100 micrometer; D: Intermediate magnification of kavain-treated samples reveal strong vacuolization of the liver parenchymal tissue (small arrow) and loss of normal sinusoidal vasculature (large arrow). Scale bar, 40 micrometer.
- Citation: Fu S, Korkmaz E, Braet F, Ngo Q, Ramzan I. Influence of kavain on hepatic ultrastructure. World J Gastroenterol 2008; 14(4): 541-546
- URL: https://www.wjgnet.com/1007-9327/full/v14/i4/541.htm
- DOI: https://dx.doi.org/10.3748/wjg.14.541


