Copyright
©2008 The WJG Press and Baishideng.
World J Gastroenterol. Jan 28, 2008; 14(4): 524-531
Published online Jan 28, 2008. doi: 10.3748/wjg.14.524
Published online Jan 28, 2008. doi: 10.3748/wjg.14.524
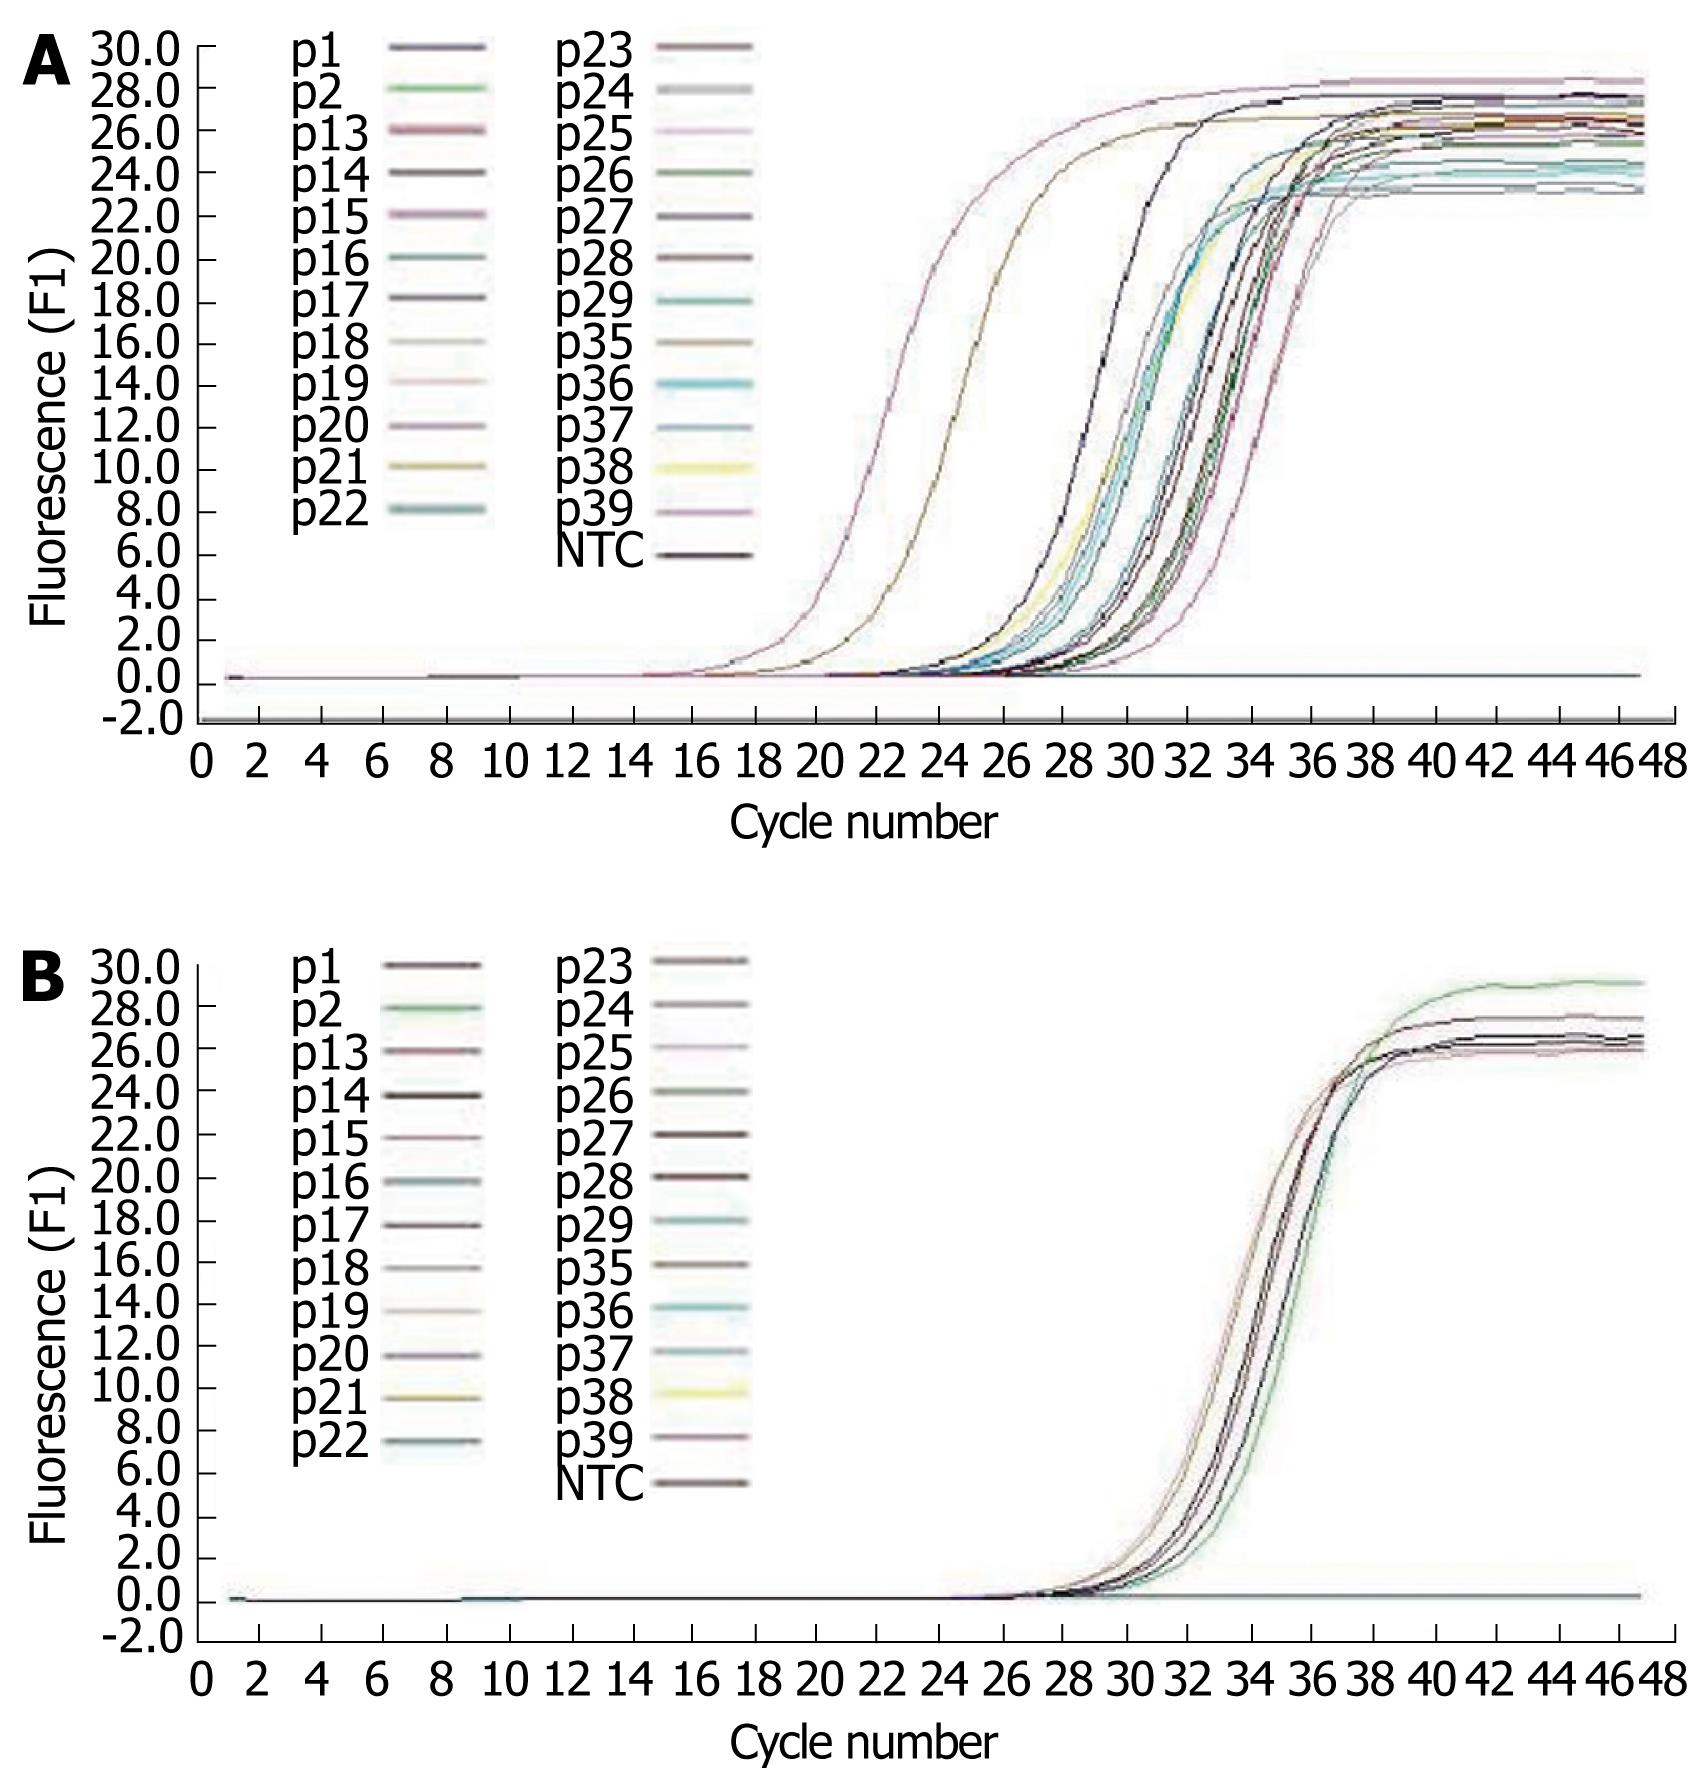
Figure 4 The photofluorogram of hypermethylated SFRP2 gene in fecal specimen performed by MethyLight.
A: Photofluorogram of SFRP2 gene performed in M (methylation) primer and its amplification condition; B: Photofluorogram of SFRP2 gene performed in U (unmethylation) primer and its amplification condition. P represents the patients; and NTC represents the negative controls.
-
Citation: Wang DR, Tang D. Hypermethylated
SFRP2 gene in fecal DNA is a high potential biomarker for colorectal cancer noninvasive screening. World J Gastroenterol 2008; 14(4): 524-531 - URL: https://www.wjgnet.com/1007-9327/full/v14/i4/524.htm
- DOI: https://dx.doi.org/10.3748/wjg.14.524


