Copyright
©2008 The WJG Press and Baishideng.
World J Gastroenterol. Oct 21, 2008; 14(39): 5980-5989
Published online Oct 21, 2008. doi: 10.3748/wjg.14.5980
Published online Oct 21, 2008. doi: 10.3748/wjg.14.5980
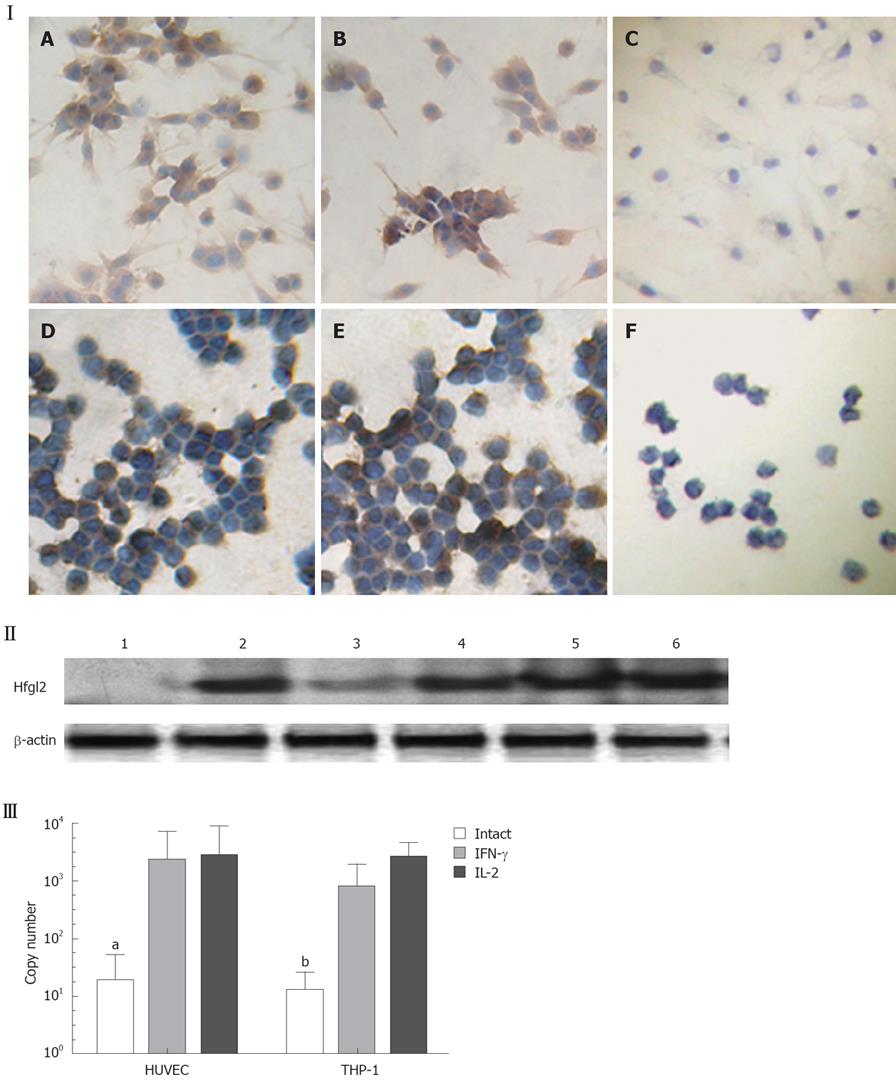
Figure 5 Increased expression of fgl2 after IFN-γ or IL-2 stimulation.
I: HUVEC and THP-1 cells were treated with IFN-γ (200 U/mL) and IL-2 (100 U/mL) and stained with antibodies specific for hfgl2. A: IFN-γ (200 U/mL, 12 h) + HUVEC (SP, × 200); B: IL-2 (100 U/mL, 8 h) + HUVEC (SP, × 200); C: NS +HUVEC (SP, × 200); D: IFN-γ (200 U/mL, 12 h) + THP-1 (SP, × 200); E: IL-2 (100 U/mL, 8 h) + THP-1(SP, × 200); F: NS + THP-1 (SP, × 200). II: Western blotting analysis of hfgl2 expression after IFN-γ (200 U/mL) and IL-2 (100 U/mL) stimulation for 12 h and 8 h on HUVEC and THP-1 cells. 1: Intact HUVEC; 2: IFN-γ + HUVEC; 3: Intact THP-1; 4: IFN-γ + THP-1; 5: IL-2 + HUVEC; 6: IL-2 +THP-1. III: Real-time PCR analysis of inducible hfgl2 mRNA after stimulation for 4 h. aP = 0.0329, vs HUVEC alone; bP = 0.0059, vs THP-1 alone.
-
Citation: Su K, Chen F, Yan WM, Zeng QL, Xu L, Xi D, Pi B, Luo XP, Ning Q. Fibrinogen-like protein 2/fibroleukin prothrombinase contributes to tumor hypercoagulability
via IL-2 and IFN-γ. World J Gastroenterol 2008; 14(39): 5980-5989 - URL: https://www.wjgnet.com/1007-9327/full/v14/i39/5980.htm
- DOI: https://dx.doi.org/10.3748/wjg.14.5980


