Copyright
©2008 The WJG Press and Baishideng.
World J Gastroenterol. Oct 14, 2008; 14(38): 5893-5899
Published online Oct 14, 2008. doi: 10.3748/wjg.14.5893
Published online Oct 14, 2008. doi: 10.3748/wjg.14.5893
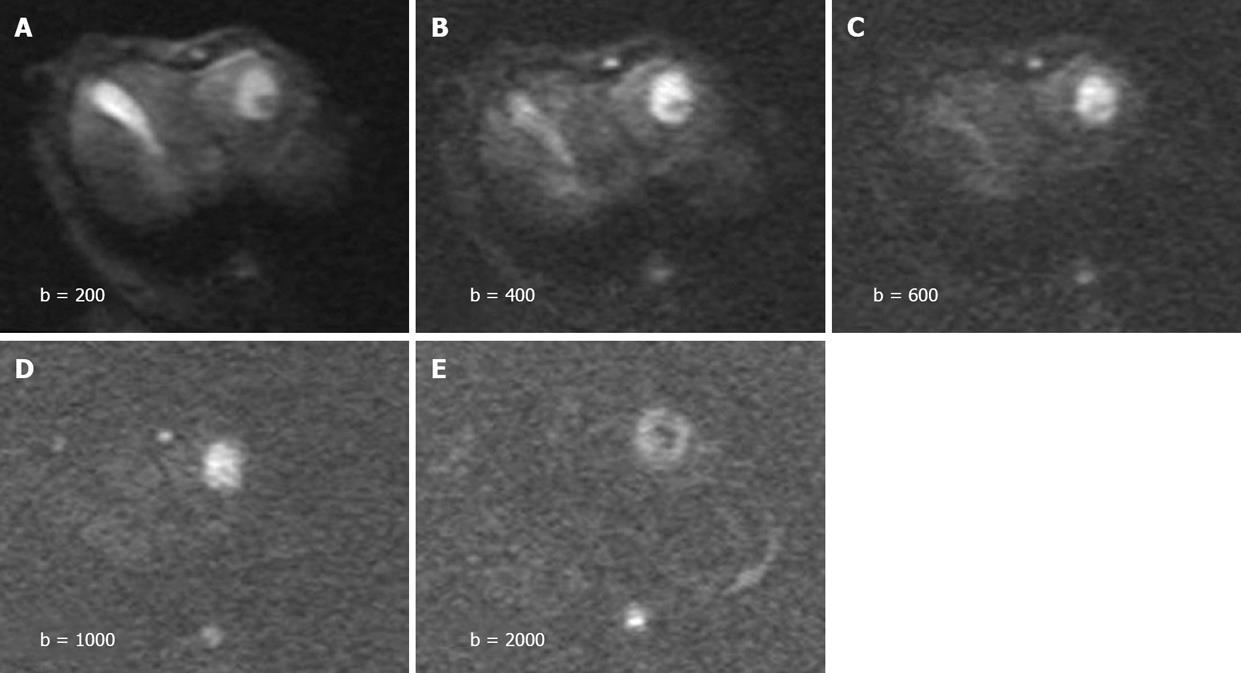
Figure 1 Diffusion-weighted images obtained with different b-values.
A and B: High signal intensity in tumors and hyperintense gallbladder on b200 and b400 DWI; C-E: Hyperintensive tumors and invisible gallbladder on b600, b1000 and b2000 DWI. The image qualities degrade with increasing b values.
- Citation: Jiang ZX, Peng WJ, Li WT, Tang F, Liu SY, Qu XD, Wang JH, Lu HF. Effect of b value on monitoring therapeutic response by diffusion-weighted imaging. World J Gastroenterol 2008; 14(38): 5893-5899
- URL: https://www.wjgnet.com/1007-9327/full/v14/i38/5893.htm
- DOI: https://dx.doi.org/10.3748/wjg.14.5893


