Copyright
©2008 The WJG Press and Baishideng.
World J Gastroenterol. Oct 14, 2008; 14(38): 5842-5850
Published online Oct 14, 2008. doi: 10.3748/wjg.14.5842
Published online Oct 14, 2008. doi: 10.3748/wjg.14.5842
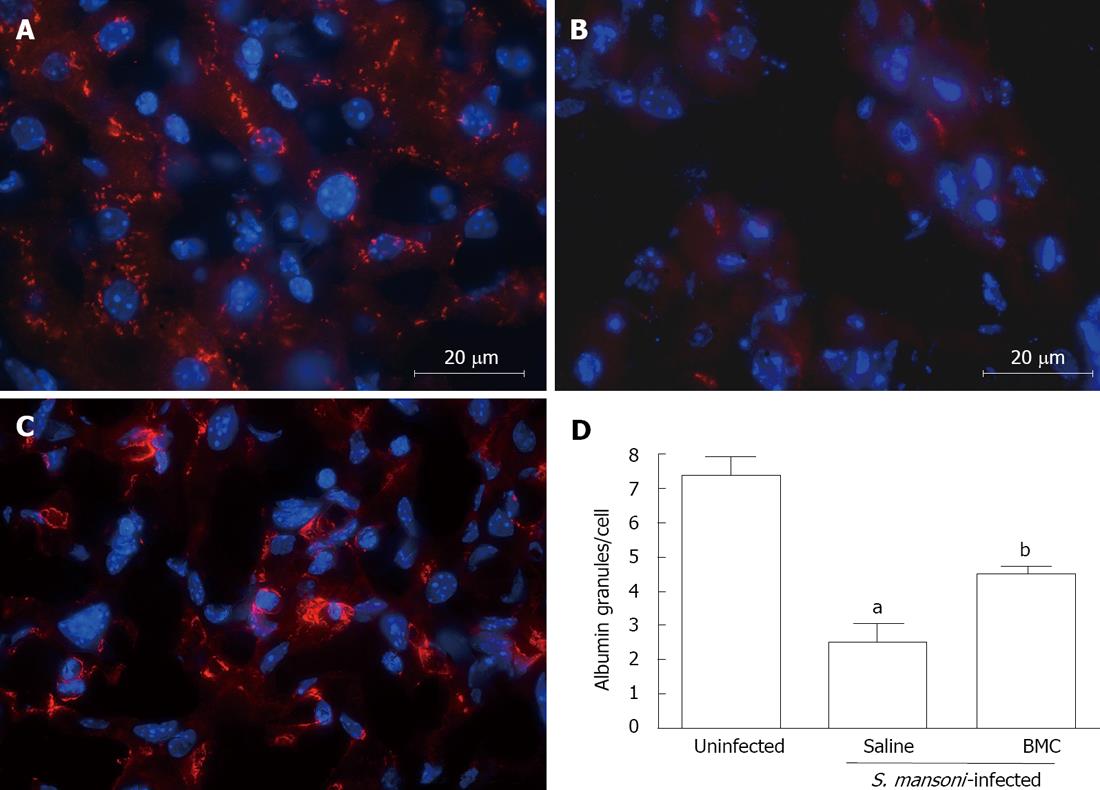
Figure 7 Increased albumin expression after BMC therapy.
Albumin (red) and nuclei (blue) staining in sections of uninfected (A), saline-treated (B) or BMC-treated (C), S.mansoni-infected mice, 2 mo after treatment by iv route. D: Albumin+ granules were quantified by morphometry in liver sections of uninfected, saline-treated or BMC-treated S.mansoni-infected mice 2 mo after cellular infusion by iv route. Data represents the mean ± SE of 7 animals per group. aP < 0.05 compared to uninfected group; bP < 0.001 compared to saline-treated group.
-
Citation: Oliveira SA, Souza BSF, Guimarães-Ferreira CA, Barreto ES, Souza SC, Freitas LAR, Ribeiro-dos-Santos R, Soares MBP. Therapy with bone marrow cells reduces liver alterations in mice chronically infected by
Schistosoma mansoni . World J Gastroenterol 2008; 14(38): 5842-5850 - URL: https://www.wjgnet.com/1007-9327/full/v14/i38/5842.htm
- DOI: https://dx.doi.org/10.3748/wjg.14.5842


