Copyright
©2008 The WJG Press and Baishideng.
World J Gastroenterol. Oct 14, 2008; 14(38): 5834-5841
Published online Oct 14, 2008. doi: 10.3748/wjg.14.5834
Published online Oct 14, 2008. doi: 10.3748/wjg.14.5834
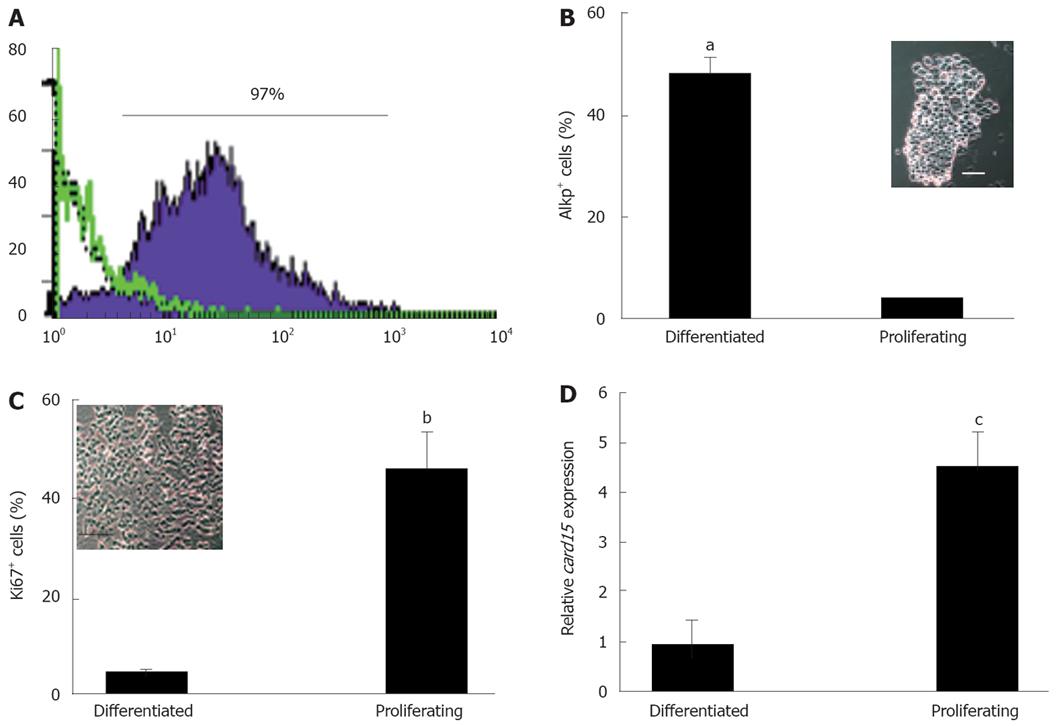
Figure 1 NOD2 expression by CECs.
A: Colonic epithelial cells were isolated by incubating segments of colon with increasing concentrations of EDTA. Purity was assessed by staining with anti-cytokeratin (filled profile) and -CD45 (green open profile) antibodies and by flow cytometry using isotype matched antibodies to determine levels of background staining (dotted open profile). The % value shown represents the frequency of cytokeratin+ cells in a representative 10 mmol/L EDTA fraction. B and C: 1 mmol/L and 10 mmol/L EDTA fractions of CECs were evaluated for the presence of differentiated and proliferating epithelial using alkaline phosphatase (AlkP) activity and Ki67 expression, respectively, as described in the Methods section. aP < 0.03 in B and bP < 0.015 in C. The morphology of cells in 1 mmol/L and 10 mmol/L EDTA fractions is depicted in the phase contrast photomicrograph insets in B (10 mmol/L) and C (1 mmol/L). Magnification is 160. Scale bar in B = 10 μm and in C = 40 μm. D: The relative levels of Card15 mRNA in fractions of colonic crypts enriched for proliferating and differentiated epithelial cells were determined by real time RT-PCR using β-actin as a reference gene. The data represents averaged values (± SE) of four experiments. cP < 0.05.
- Citation: Cruickshank SM, Wakenshaw L, Cardone J, Howdle PD, Murray PJ, Carding SR. Evidence for the involvement of NOD2 in regulating colonic epithelial cell growth and survival. World J Gastroenterol 2008; 14(38): 5834-5841
- URL: https://www.wjgnet.com/1007-9327/full/v14/i38/5834.htm
- DOI: https://dx.doi.org/10.3748/wjg.14.5834


