Copyright
©2008 The WJG Press and Baishideng.
World J Gastroenterol. Oct 7, 2008; 14(37): 5689-5694
Published online Oct 7, 2008. doi: 10.3748/wjg.14.5689
Published online Oct 7, 2008. doi: 10.3748/wjg.14.5689
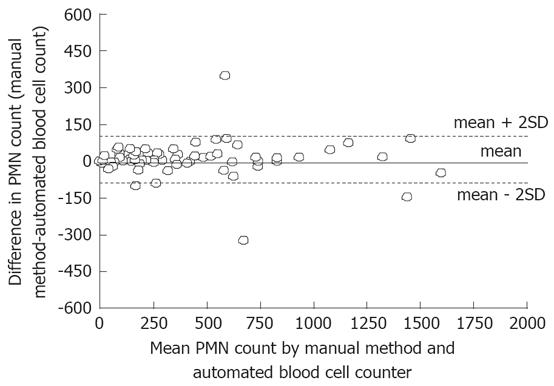
Figure 1 PMN cell count-Scatter plot of the differences between the manual method and the automated blood cell counter against the mean of the two measurements, showing the limits of agreement defined as the mean of the difference ± 2SD.
- Citation: Riggio O, Angeloni S, Parente A, Leboffe C, Pinto G, Aronne T, Merli M. Accuracy of the automated cell counters for management of spontaneous bacterial peritonitis. World J Gastroenterol 2008; 14(37): 5689-5694
- URL: https://www.wjgnet.com/1007-9327/full/v14/i37/5689.htm
- DOI: https://dx.doi.org/10.3748/wjg.14.5689


