Copyright
©2008 The WJG Press and Baishideng.
World J Gastroenterol. Oct 7, 2008; 14(37): 5665-5673
Published online Oct 7, 2008. doi: 10.3748/wjg.14.5665
Published online Oct 7, 2008. doi: 10.3748/wjg.14.5665
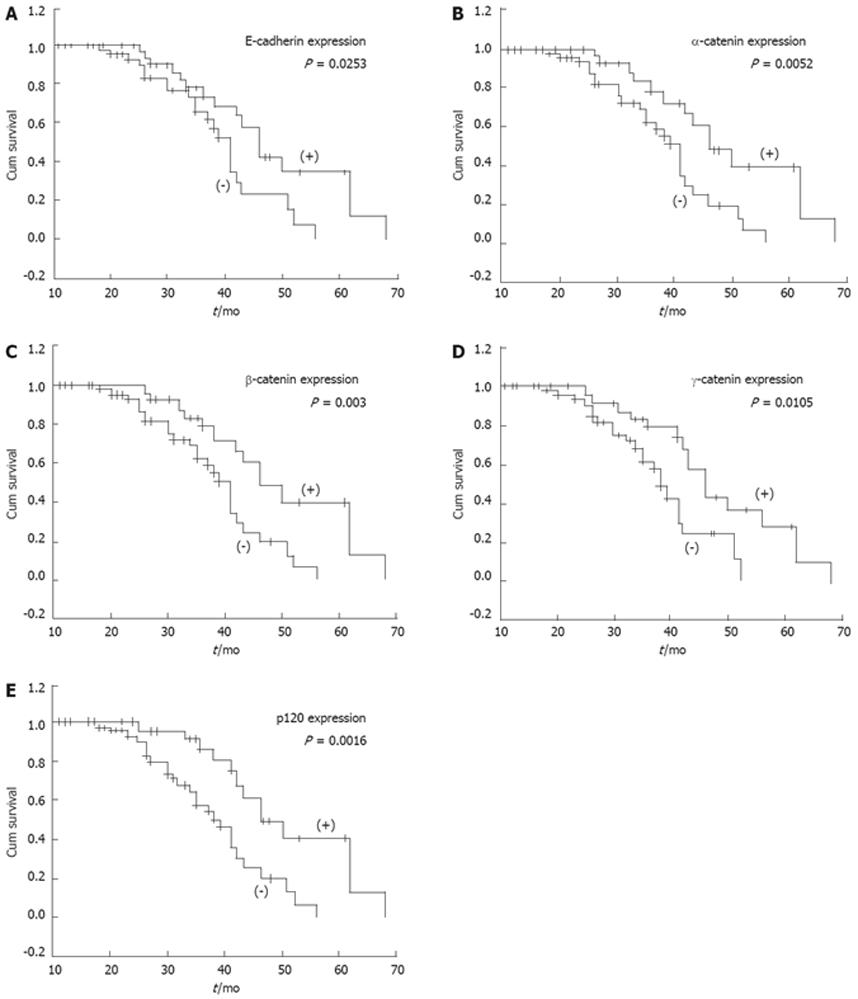
Figure 3 Kaplan-Meier survival curves with normal (pink line) or abnormal (green line), A: Expression of E-cadherin (P = 0.
0253); B: Expression of α-catenin (P = 0.0052); C: Expression of β-catenin (P = 0.003); D: Expression of γ-catenin (P = 0.0105); E: Expression of p120 (P = 0.0016). Abnormal expressions of E-cadherin/catenin complex significantly related with poor survival.
- Citation: Zhai B, Yan HX, Liu SQ, Chen L, Wu MC, Wang HY. Reduced expression of E-cadherin/catenin complex in hepatocellular carcinomas. World J Gastroenterol 2008; 14(37): 5665-5673
- URL: https://www.wjgnet.com/1007-9327/full/v14/i37/5665.htm
- DOI: https://dx.doi.org/10.3748/wjg.14.5665


