Copyright
©2008 The WJG Press and Baishideng.
World J Gastroenterol. Sep 7, 2008; 14(33): 5186-5191
Published online Sep 7, 2008. doi: 10.3748/wjg.14.5186
Published online Sep 7, 2008. doi: 10.3748/wjg.14.5186
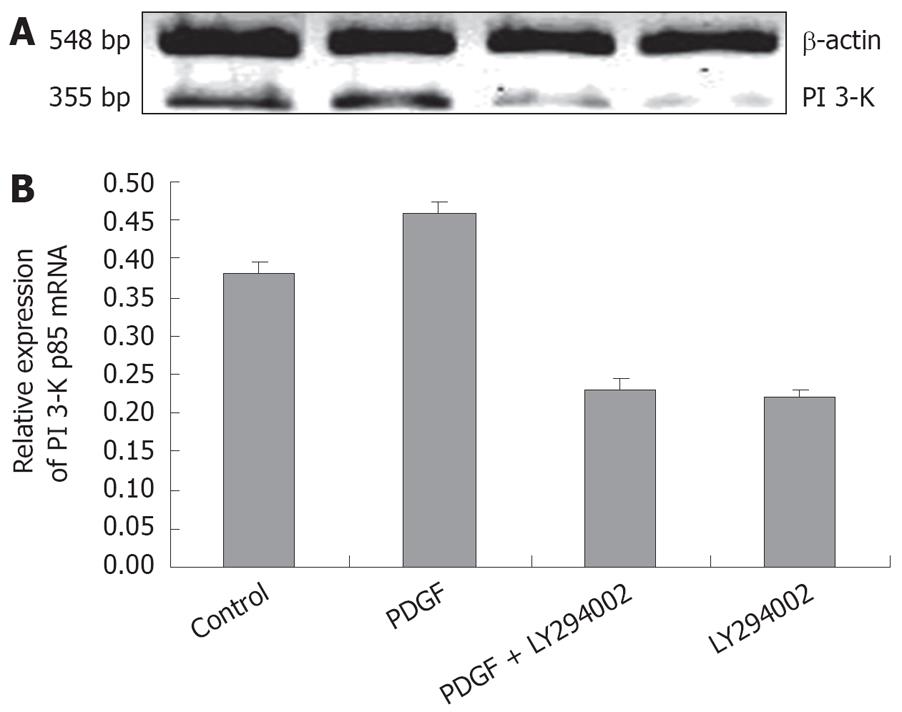
Figure 4 Representative RT-PCR photography of PI 3-K mRNA transcription from rat HSC, β-actin as internal control.
A: From left, 1st lane, control HSC; 2nd lane, PDGF stimulated HSC; 3rd lane, PDGF + LY 294002 group and 4th lane, LY 294002 treated HSC. B: A graphic analysis of the RNase protection assay.
- Citation: Wang Y, Jiang XY, Liu L, Jiang HQ. Phosphatidylinositol 3-kinase/Akt pathway regulates hepatic stellate cell apoptosis. World J Gastroenterol 2008; 14(33): 5186-5191
- URL: https://www.wjgnet.com/1007-9327/full/v14/i33/5186.htm
- DOI: https://dx.doi.org/10.3748/wjg.14.5186


