Copyright
©2008 The WJG Press and Baishideng.
World J Gastroenterol. Jul 28, 2008; 14(28): 4462-4472
Published online Jul 28, 2008. doi: 10.3748/wjg.14.4462
Published online Jul 28, 2008. doi: 10.3748/wjg.14.4462
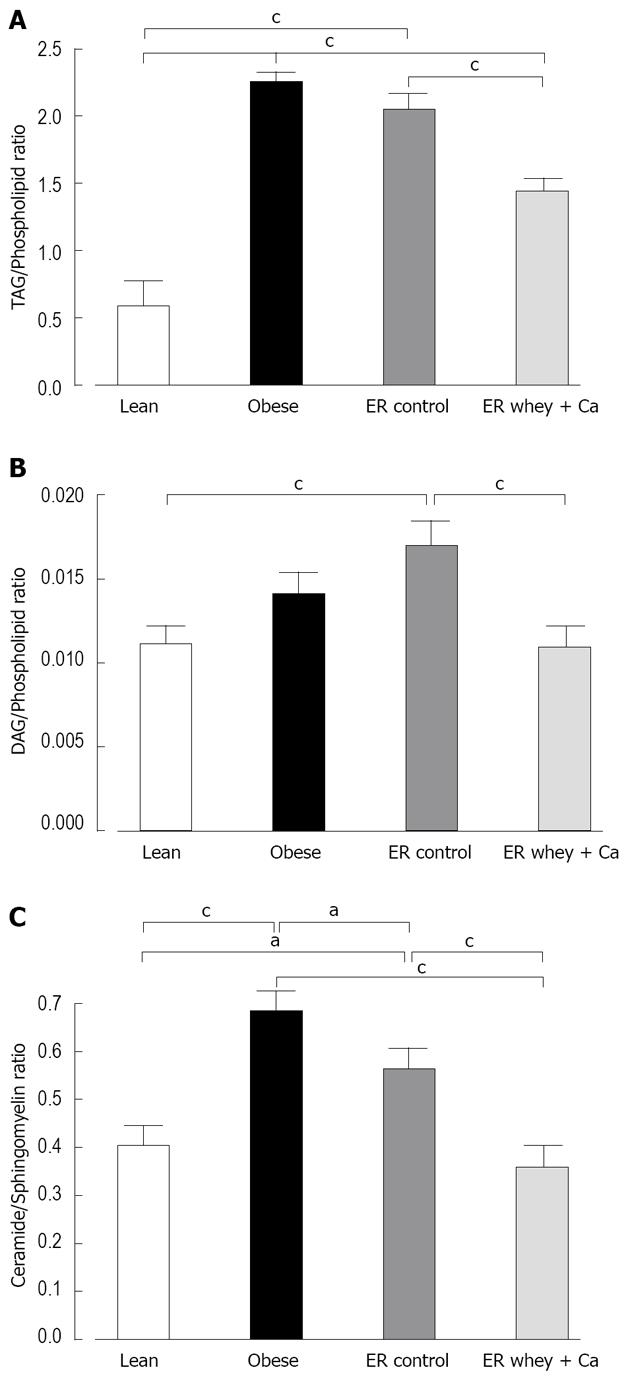
Figure 5 A: The liver TAG/Phospholipid ratio; B: The liver DAG/Phospholipid ratio; C: The liver Ceramide/Sphingomyelin ratio.
Lipids measured by UPLC/MS. Data is presented as mean ± SE. The letters denote a significant difference between the groups (aP < 0.05; bP < 0.01, cP < 0.001; n = 10/group).
- Citation: Pilvi TK, Seppänen-Laakso T, Simolin H, Finckenberg P, Huotari A, Herzig KH, Korpela R, Orešič M, Mervaala EM. Metabolomic changes in fatty liver can be modified by dietary protein and calcium during energy restriction. World J Gastroenterol 2008; 14(28): 4462-4472
- URL: https://www.wjgnet.com/1007-9327/full/v14/i28/4462.htm
- DOI: https://dx.doi.org/10.3748/wjg.14.4462


