Copyright
©2008 The WJG Press and Baishideng.
World J Gastroenterol. Jul 28, 2008; 14(28): 4462-4472
Published online Jul 28, 2008. doi: 10.3748/wjg.14.4462
Published online Jul 28, 2008. doi: 10.3748/wjg.14.4462
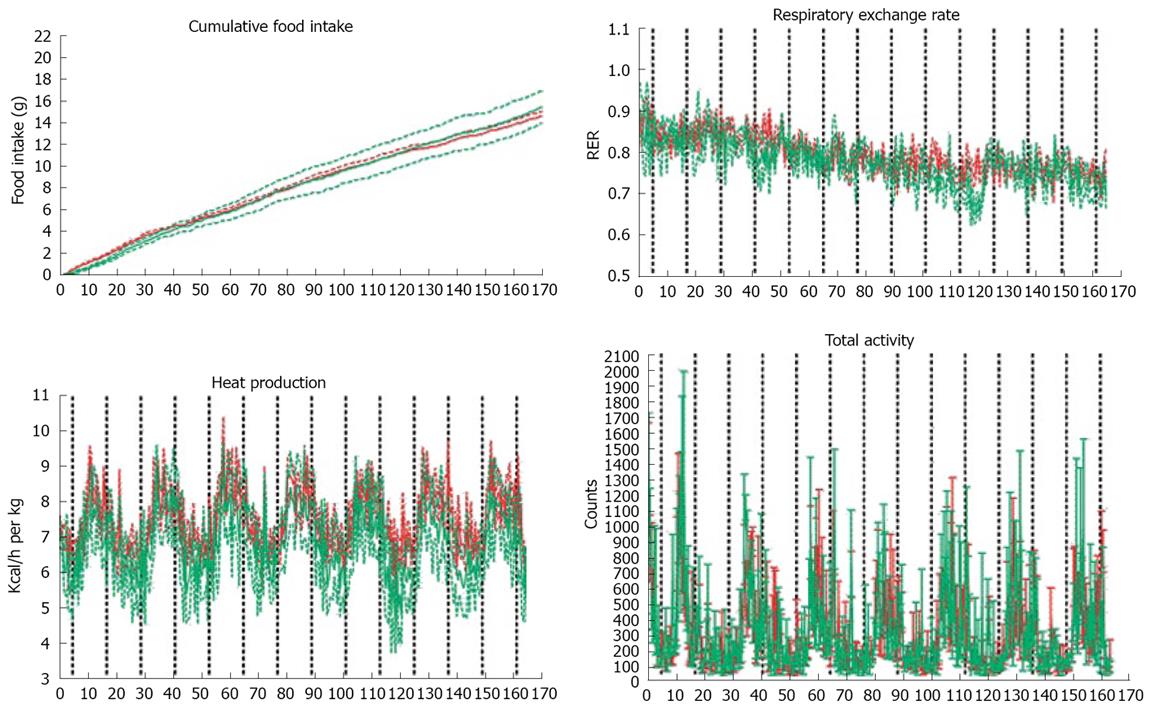
Figure 3 A: Cumulative food intake over 7 d analyzed by LabMaster system.
The cumulative total food intake was similar between the groups; B: LabMaster analysis of respiratory exchange rate (RER); C: Heat production measured by LabMaster; D: Total ambulatory movement did not differ between the groups. In all figures data is presented as mean ± SE, n = 4 in casein group (red) and n = 3 in whey group (green).
- Citation: Pilvi TK, Seppänen-Laakso T, Simolin H, Finckenberg P, Huotari A, Herzig KH, Korpela R, Orešič M, Mervaala EM. Metabolomic changes in fatty liver can be modified by dietary protein and calcium during energy restriction. World J Gastroenterol 2008; 14(28): 4462-4472
- URL: https://www.wjgnet.com/1007-9327/full/v14/i28/4462.htm
- DOI: https://dx.doi.org/10.3748/wjg.14.4462


