Copyright
©2008 The WJG Press and Baishideng.
World J Gastroenterol. Jul 21, 2008; 14(27): 4309-4318
Published online Jul 21, 2008. doi: 10.3748/wjg.14.4309
Published online Jul 21, 2008. doi: 10.3748/wjg.14.4309
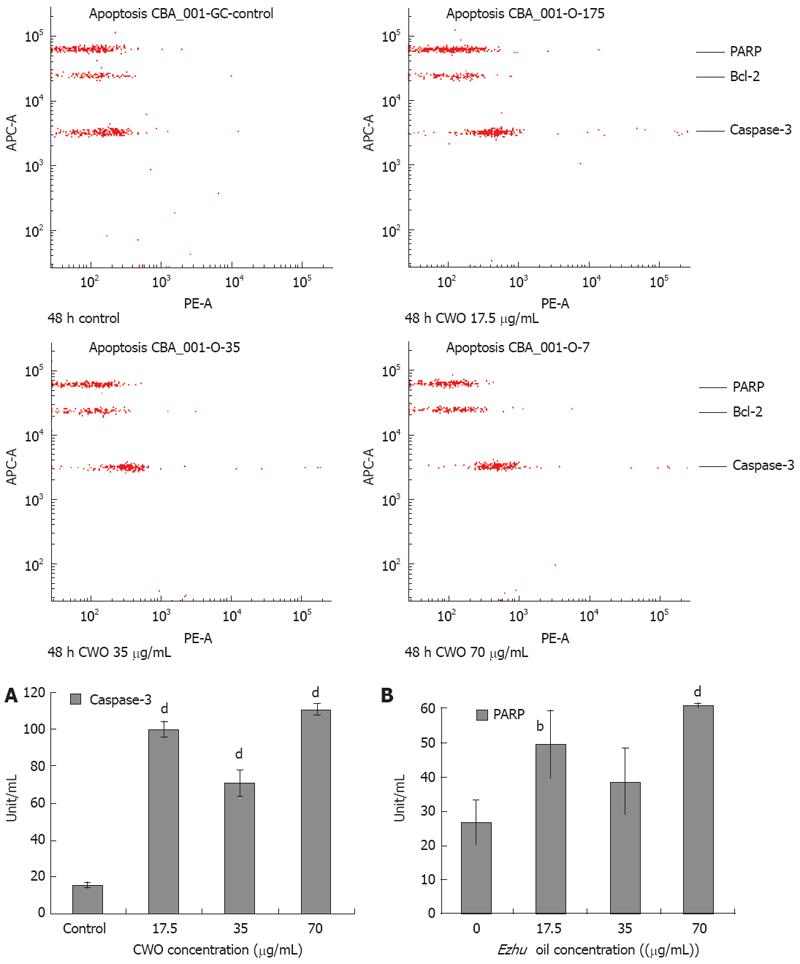
Figure 7 Protein expression levels of active caspase-3 and cleaved PARP in CWO-induced apoptosis.
HepG2 cells were treated with medium alone (control) or different concentration of CWO for 48 h. Cells of each sample were counted to 1.0 × 10⁶ and all the samples were normalized to final protein concentration in 0.2 &mgr;g/&mgr;L. It was detected with BDTM CBA Human Apoptosis Kit (BD, Franklin Lakes, USA) according to manufacturer instruction. The results were analyzed by FCAP Array V1.0. Active caspase-3 protein level in HepG2 was shown in (A) and the cleaved PARP protein level in HepG2 was shown in (B). The x-axis indicated the concentration of CWO while the y-axis indicated amount of proteins (unit per mL). Concentration of active caspase-3 and cleaved PARP in test samples were determined using the standard curve. Data expressed as mean ± SD from three independent experiments. bP < 0.01, dP < 0.001 vs control.
-
Citation: Xiao Y, Yang FQ, Li SP, Hu G, Lee SMY, Wang YT. Essential oil of
Curcuma wenyujin induces apoptosis in human hepatoma cells. World J Gastroenterol 2008; 14(27): 4309-4318 - URL: https://www.wjgnet.com/1007-9327/full/v14/i27/4309.htm
- DOI: https://dx.doi.org/10.3748/wjg.14.4309


