Copyright
©2008 The WJG Press and Baishideng.
World J Gastroenterol. Jul 21, 2008; 14(27): 4309-4318
Published online Jul 21, 2008. doi: 10.3748/wjg.14.4309
Published online Jul 21, 2008. doi: 10.3748/wjg.14.4309
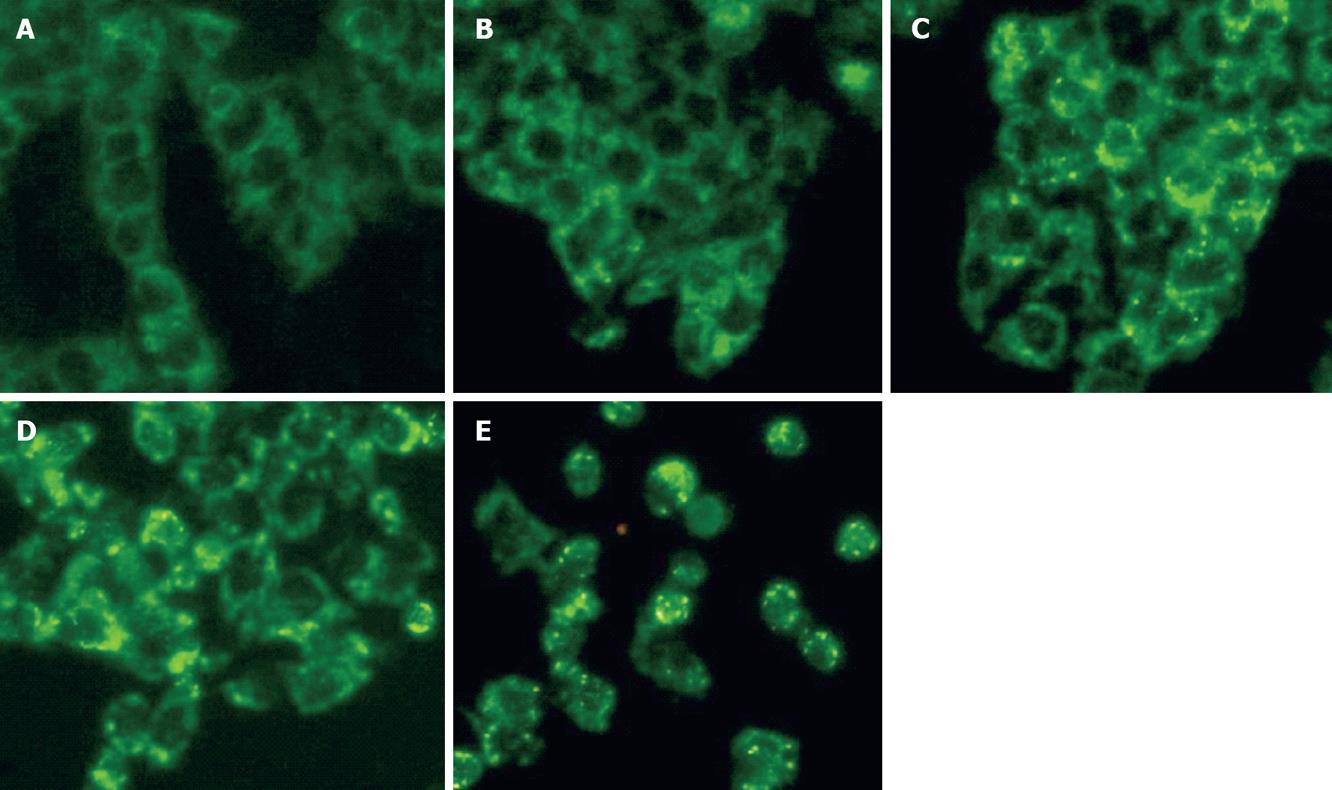
Figure 5 Cytochrome C release into the cytosol in CWO treated HepG2 cells for 12 h.
Cytochrome C immunofluorescence was observed with fluorescent microscope. A: Control; B: 17.5 &mgr;g/mL; C: 35 &mgr;g/mL; D: 70 mg/mL; E: 120 mg/mL. Fine punctate/granular stainings for cytochrome C are observed. Cytochrome C release also
increases the global cytosolic fluorescent signal. Similar results were obtained for 3 independent experiments (× 20).
-
Citation: Xiao Y, Yang FQ, Li SP, Hu G, Lee SMY, Wang YT. Essential oil of
Curcuma wenyujin induces apoptosis in human hepatoma cells. World J Gastroenterol 2008; 14(27): 4309-4318 - URL: https://www.wjgnet.com/1007-9327/full/v14/i27/4309.htm
- DOI: https://dx.doi.org/10.3748/wjg.14.4309


