Copyright
©2008 The WJG Press and Baishideng.
World J Gastroenterol. Jul 21, 2008; 14(27): 4309-4318
Published online Jul 21, 2008. doi: 10.3748/wjg.14.4309
Published online Jul 21, 2008. doi: 10.3748/wjg.14.4309
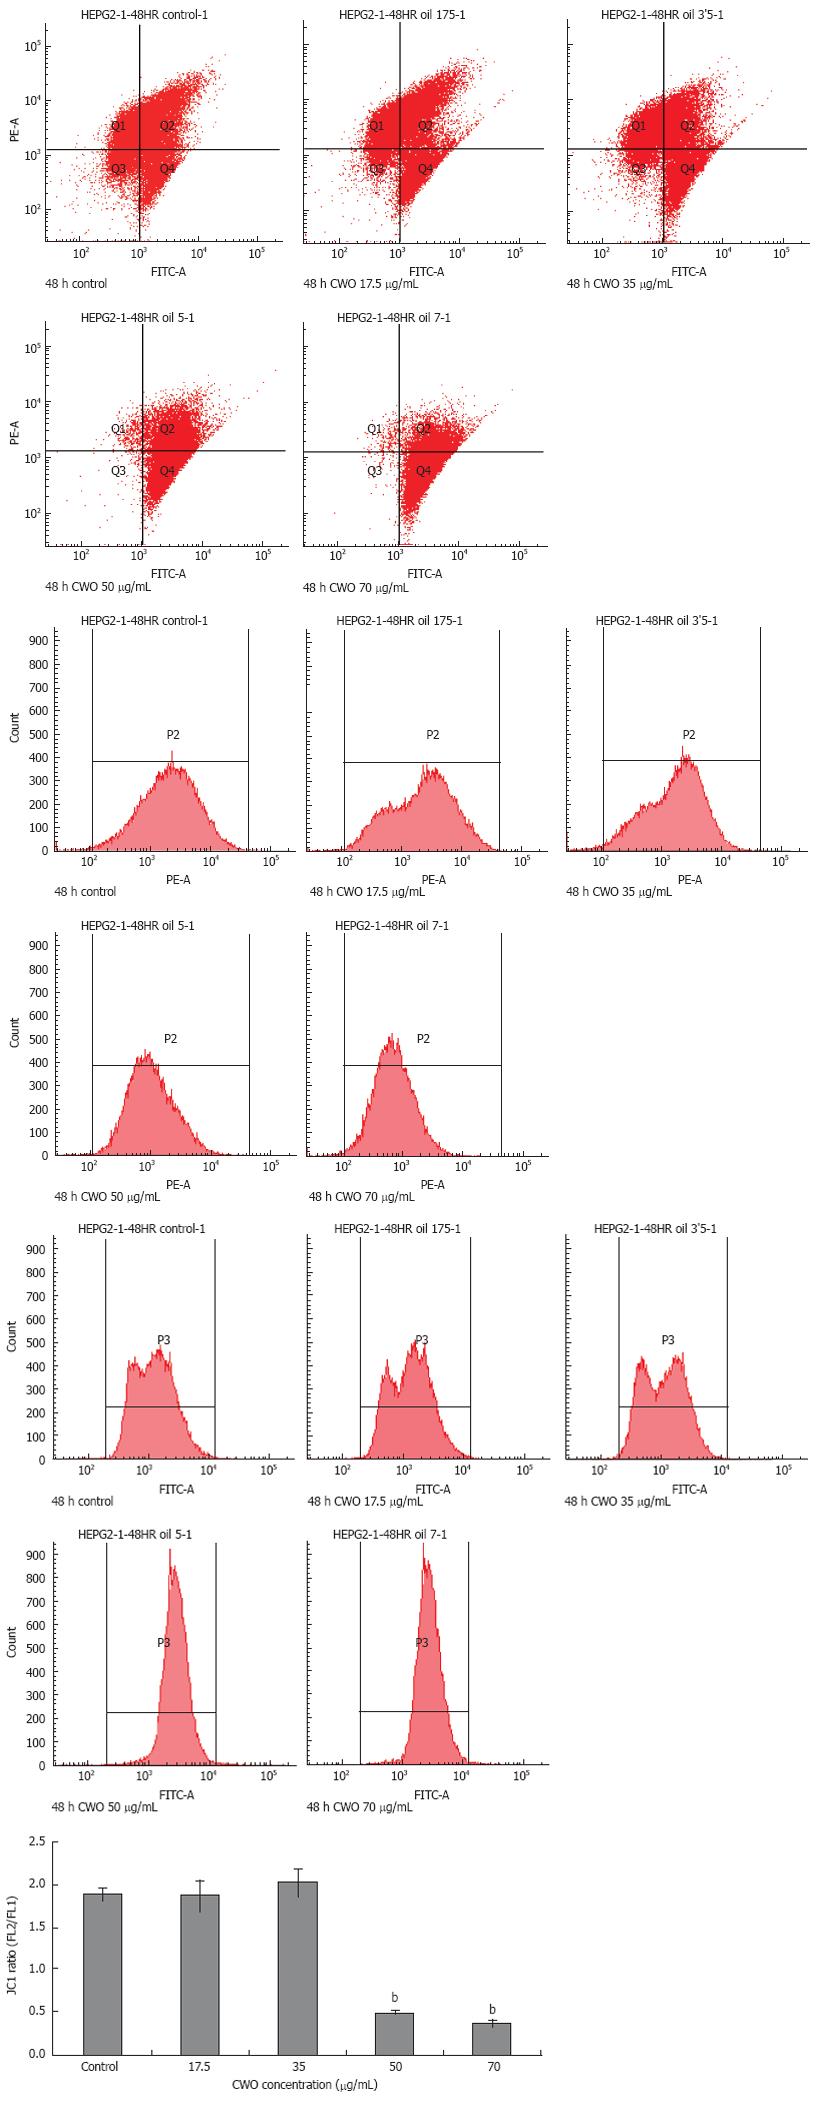
Figure 4 Analysis of change of ΔΨm in HepG2 cells.
HepG2 treated with 17.5, 35 , 50, and 70 &mgr;g/mL for 48 h, were stained with JC-1 probe. The cells were analyzed by FCM. Red and green fluorescence were measured by FL2 and FL1 channel, respectively. Red fluorescence indicates intact mitochondrial potential while green fluorescence indicates breakdown of mitochondrial potential. The ratio of intensity of FL2 to FL1 indicates the change of ΔΨm. Data expressed as mean ± SD from four independent experiments. bP < 0.001 vs control.
-
Citation: Xiao Y, Yang FQ, Li SP, Hu G, Lee SMY, Wang YT. Essential oil of
Curcuma wenyujin induces apoptosis in human hepatoma cells. World J Gastroenterol 2008; 14(27): 4309-4318 - URL: https://www.wjgnet.com/1007-9327/full/v14/i27/4309.htm
- DOI: https://dx.doi.org/10.3748/wjg.14.4309


